Tornado Formation and Intensity
How do tornadoes form and how strong will they be? Tornado genesis requires vorticity generation, tilting, and stretching within supercell thunderstorms. This model derives vorticity equations, implements Rankine vortex models, demonstrates Enhanced Fujita Scale damage assessment, and predicts tornado intensity from environmental parameters.
Prerequisites: vorticity equation, angular momentum, rankine vortex, ef scale
1. The Question
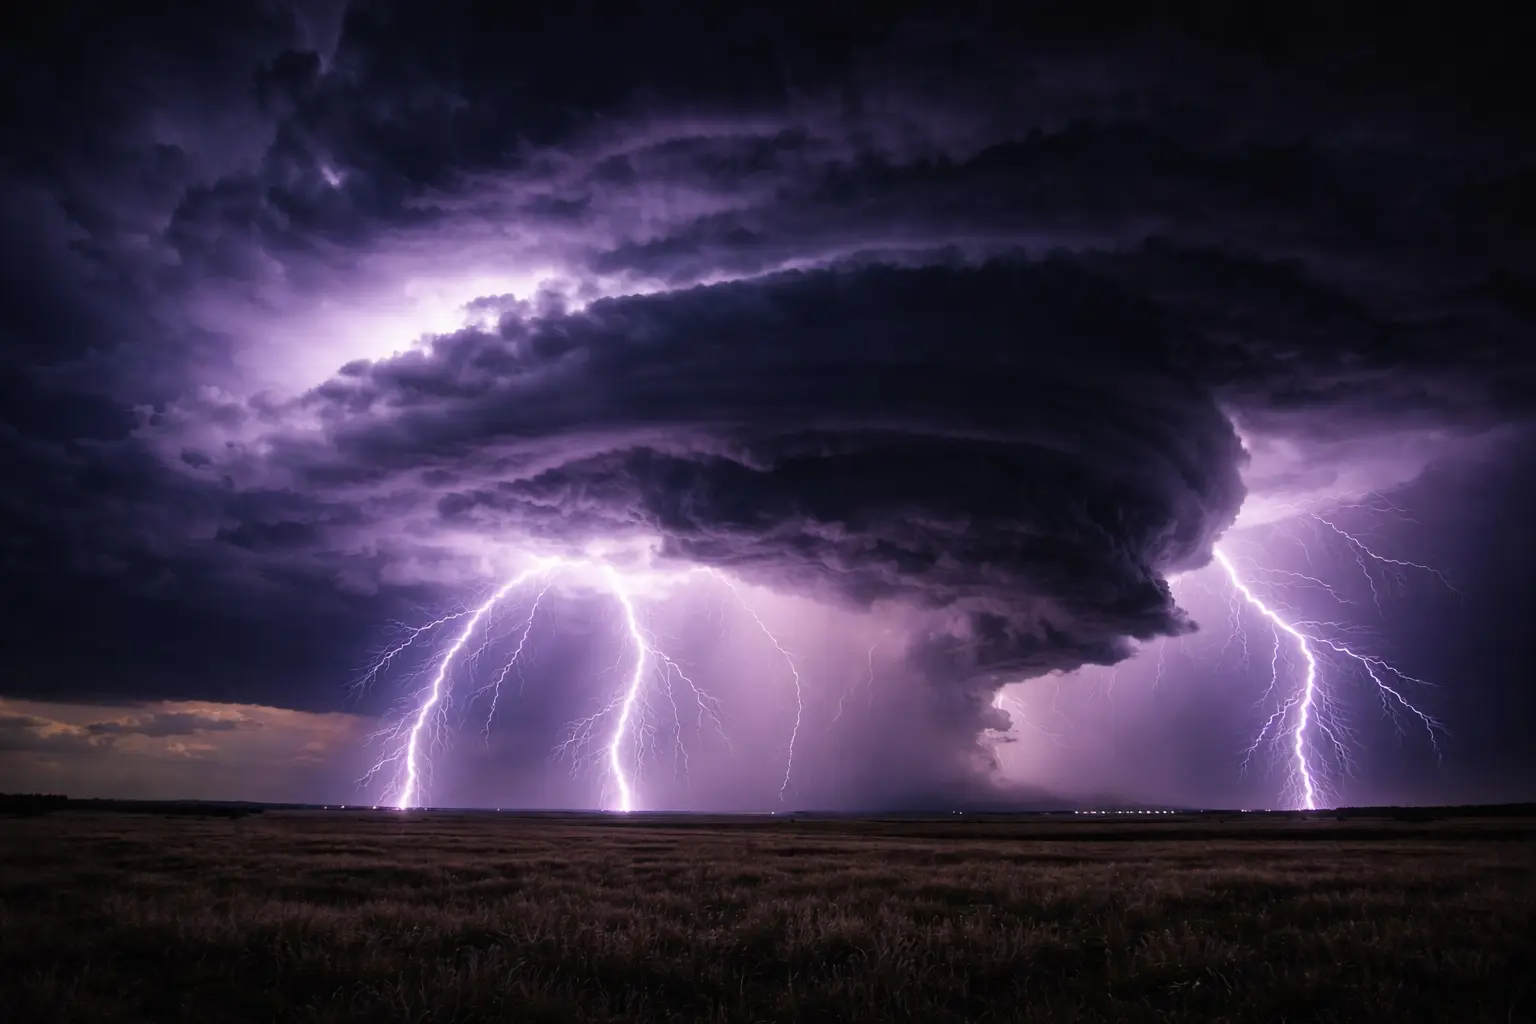
Will this supercell produce a violent tornado?
Tornado definition:
Violently rotating column of air in contact with ground and cloud base.
Formation requirements:
- Vorticity: Rotation in atmosphere
- Stretching: Vertical convergence amplifies rotation
- Tilting: Horizontal to vertical vorticity
- Concentration: Focus rotation into narrow column
Intensity scale (Enhanced Fujita):
EF0: 65-85 mph (105-137 km/h) - Light damage
EF1: 86-110 mph (138-177 km/h) - Moderate
EF2: 111-135 mph (178-217 km/h) - Considerable
EF3: 136-165 mph (218-266 km/h) - Severe
EF4: 166-200 mph (267-322 km/h) - Devastating
EF5: >200 mph (>322 km/h) - Incredible
Statistics (USA):
- ~1200 tornadoes/year average
- 80% EF0-EF1 (weak)
- <1% EF5 (violent)
- Peak season: April-June
- Peak time: 4-9 PM local
Applications:
- Tornado warning issuance
- Building design standards
- Risk assessment
- Climatology studies
2. The Conceptual Model
Vorticity
Rotation in fluid:
\[\omega = \nabla \times \mathbf{v}\]Where:
- $\omega$ = vorticity vector (s⁻¹)
- $\mathbf{v}$ = velocity field
Vertical vorticity:
\[\zeta = \frac{\partial v}{\partial x} - \frac{\partial u}{\partial y}\]Where $u, v$ = horizontal wind components.
Sources:
Horizontal vorticity from wind shear (environmental)
Tilted into vertical by updraft
Stretched by vertical convergence
Vorticity Equation
Evolution:
\[\frac{D\omega}{Dt} = (\omega \cdot \nabla)\mathbf{v} - \omega(\nabla \cdot \mathbf{v})\]Simplified (for vertical vorticity):
Stretching term:
\[\frac{D\zeta}{Dt} = -\zeta \frac{\partial w}{\partial z}\]If updraft converges ($\partial w/\partial z > 0$):
Vorticity amplifies!
Example:
Initial $\zeta = 0.01$ s⁻¹ (environmental)
Updraft stretching: $\partial w/\partial z = 0.01$ s⁻¹
After 100 seconds:
\[\zeta \approx \zeta_0 e^{t \partial w/\partial z} = 0.01 \times e^{0.01 \times 100} = 0.01 \times e = 0.027 \text{ s}^{-1}\]Nearly tripled!
Rankine Vortex
Idealized tornado structure:
Core (r < R): Solid-body rotation
\[v(r) = \frac{V_{max}}{R} r\]Outer (r > R): Potential vortex
\[v(r) = \frac{V_{max} R}{r}\]Where:
- $V_{max}$ = maximum tangential velocity
- $R$ = radius of maximum wind (RMW)
Typical: RMW = 100-500 m for tornadoes
Pressure deficit:
\[\Delta p = \frac{\rho V_{max}^2}{2}\]For 100 m/s tornado:
\[\Delta p = \frac{1.2 \times 100^2}{2} = 6000 \text{ Pa} = 60 \text{ mb}\]6% pressure drop!
3. Building the Mathematical Model
Tornado Vortex Signature (TVS)
Doppler radar detects:
Rotation via velocity couplet.
Gate-to-gate shear:
\[S = \frac{V_{in} - V_{out}}{d}\]Where:
- $V_{in}$ = inbound velocity
- $V_{out}$ = outbound velocity
- $d$ = distance between gates
TVS criteria:
$S > 0.01$ s⁻¹ and persistent
Example:
$V_{in} = -30$ m/s, $V_{out} = +30$ m/s, $d = 2$ km
\[S = \frac{30 - (-30)}{2000} = \frac{60}{2000} = 0.03 \text{ s}^{-1}\]Strong rotation → tornado warning
EF-Scale Damage Indicators
Degree of Damage (DOD):
Observable damage to specific structures.
Example - One/two family residence:
DOD 1: Loss of roof covering (<20%)
DOD 4: Loss of roof structure and outer walls
DOD 10: Complete destruction, swept away
Wind speed estimate:
Each DOD has expected wind range.
DOD 4: 110-135 mph → EF2
Uncertainty: ±20 mph typical
Multiple indicators averaged for final rating.
Conditional Tornado Probability
Given supercell, what’s tornado probability?
Environmental parameters:
\[P_{tor} = f(CAPE, SRH, LCL, shear)\]Empirical model:
\[P_{tor} = \frac{1}{1 + e^{-z}}\]Where:
\[z = a + b \times STP + c \times \log(CAPE) + d \times LCL\]Typical calibration:
STP > 1: P ~ 30%
STP > 3: P ~ 60%
STP > 6: P ~ 80%
Violent tornado (EF4+):
STP > 4, low LCL (<800 m), strong low-level shear
4. Worked Example by Hand
Problem: Estimate tornado intensity from damage survey.
Damage observations:
Structure 1: Single-family home
- Roof completely removed
- Some exterior walls collapsed
- Frame mostly intact
Structure 2: Metal outbuilding
- Completely destroyed
- Debris scattered 200 m
Structure 3: Softwood trees
- Debarked
- Snapped at trunk
Radar data:
- TVS detected: $S = 0.025$ s⁻¹
- Mesocyclone diameter: 4 km
Estimate EF rating and wind speed.
Solution
Step 1: Analyze Structure 1
Single-family residence:
- Roof removed completely: DOD 4-5
- Walls partially collapsed: DOD 5-6
EF-Scale lookup:
DOD 4-5: 111-135 mph → EF2
DOD 5-6: 136-165 mph → EF3
Conservative estimate: Lower bound = EF2 (111-135 mph)
Step 2: Structure 2
Metal outbuilding completely destroyed:
Weaker construction, expected failure at lower winds.
DOD for complete destruction: 100-120 mph → EF1-EF2
Consistent with Structure 1
Step 3: Structure 3
Debarked softwood trees:
High-end damage indicator.
Expected: 130-160 mph → EF2-EF3
Step 4: Synthesis
Multiple indicators point to EF2-EF3 boundary.
Best estimate: EF3 (low-end)
Wind speed: 136-145 mph
Step 5: Radar validation
TVS shear: 0.025 s⁻¹
Estimated tangential velocity:
\[V \approx S \times R = 0.025 \times 2000 = 50 \text{ m/s} = 112 \text{ mph}\]Underestimate (radar at 1-2 km altitude, surface winds higher)
Surface factor: Typically 1.2-1.5×
\[V_{surface} \approx 112 \times 1.3 = 146 \text{ mph}\]Consistent with EF3 low-end!
Final rating: EF3, estimated peak winds 140 mph
5. Computational Implementation
Below is an interactive tornado vortex simulator.
EF Rating: --
Pressure deficit: -- mb
Core vorticity: -- s⁻¹
Damage range: --
Observations:
- Rankine vortex shows linear increase to RMW, then decay
- Maximum winds at radius of maximum wind (RMW)
- Modified profile more realistic with smoother peak
- Pressure deficit proportional to velocity squared
- Core vorticity highest in narrow tornadoes
- EF rating based on maximum wind speed
Key insights:
- Violent tornadoes (EF4-EF5) have extreme pressure deficits
- Small RMW concentrates damage in narrow path
- Vorticity in core reaches 0.1-0.5 s⁻¹
- Wind profile critical for damage assessment
6. Interpretation
Tornado Climatology
Spatial distribution (USA):
Tornado Alley: Oklahoma, Kansas, Nebraska
Dixie Alley: Alabama, Mississippi, Tennessee
Seasonal variation:
- Spring: Peak activity (April-June)
- Summer: Northern plains active
- Fall: Secondary peak (October-November)
- Winter: Minimal, Gulf Coast only
Diurnal:
- Peak: 4-9 PM local
- Overnight tornadoes: More deadly (sleeping population)
Long-term trends:
Number increasing (better detection)
Variability increasing (fewer days, but more intense outbreaks)
Warning Performance
Lead time:
Average ~15 minutes (2020s)
Historical ~5 minutes (1990s)
Improvement from:
- Doppler radar (TVS detection)
- Dual-polarization (TDS)
- Spotter networks
- Probabilistic forecasts
False alarm ratio:
~70% (tornado warned but no tornado)
Challenge: Balance specificity vs safety
Probability of Detection:
~80% (tornado occurred, warning issued)
Misses: Weak tornadoes, radar limitations
Building Design
Tornado-resistant construction:
Safe rooms (FEMA):
- Withstand 250 mph winds
- EF5-rated (3-second gust)
- Reinforced concrete or steel
Residential:
- Interior room, lowest floor
- No windows
- Away from exterior walls
Critical infrastructure:
- Hospitals: Hardened patient areas
- Schools: Gymnasiums as shelters
- Data centers: EF3+ rated
Cost-benefit:
$5,000-10,000 safe room vs potential lives saved.
7. What Could Go Wrong?
Satellite Tornadoes
Multiple vortices around main tornado.
Smaller, but intense (100+ mph).
Damage path: Cycloidal, unpredictable
Radar: May not resolve (too small)
Warning challenge: Unexpected damage swaths
QLCS Tornadoes
Quasi-linear convective system (squall line).
Different from supercell:
- Weaker (typically EF0-EF2)
- Shorter-lived (minutes)
- Minimal warning time (5-10 min)
- Often rain-wrapped (invisible)
Mesovortices: Embedded rotation in QLCS
Forecast difficulty: Less predictable than supercells
Rapid Intensification
EF1 → EF4 in minutes
Example - El Reno 2013:
Widened from 1 mile to 2.6 miles in seconds
Accelerated violently
Killed storm chasers (thought safe distance)
Unpredictable via current models
Nocturnal Tornadoes
Overnight tornadoes harder to detect:
Visual confirmation: Impossible (dark)
Spotters: Fewer active
Population: Asleep, miss warnings
Higher fatality rate: 2-3× daytime
2008 Super Tuesday outbreak:
57 tornadoes, 57 deaths (many overnight)
8. Extension: Mobile Radar Observations
Doppler on Wheels (DOW):
Truck-mounted X-band radar.
High resolution: 50-100 m
Close range: <10 km
Observations:
Record winds: 301 mph (EF5+), Bridge Creek 1999
RMW: As small as 50 m
Sub-vortices: Multiple resolved
Vertical structure: 3D mapping
Scientific value:
Validate models
Understand tornadogenesis
Improve warnings
9. Math Refresher: Conservation of Angular Momentum
Angular Momentum
\[L = m r v\]Or for continuum:
\[L = \int r^2 \omega \, dm\]Conservation:
If no external torque:
\[r_1 v_1 = r_2 v_2\]Tornado application:
Air parcel drawn inward (r decreases)
Velocity must increase (v increases)
Example:
$r_1 = 1000$ m, $v_1 = 10$ m/s
$r_2 = 100$ m
\[v_2 = \frac{r_1 v_1}{r_2} = \frac{1000 \times 10}{100} = 100 \text{ m/s}\]10× velocity increase from 10× radius decrease!
Summary
- Tornado formation requires vorticity generation, tilting into vertical, and stretching by updraft
- Vorticity equation shows exponential amplification from vertical convergence in updrafts
- Rankine vortex provides idealized wind profile with maximum winds at RMW typically 100-500m
- Enhanced Fujita Scale rates tornado intensity EF0-EF5 based on damage indicators
- Pressure deficit in core reaches 40-100 mb for violent tornadoes from velocity squared relationship
- Tornado Vortex Signature on Doppler radar enables detection and warning issuance
- Average warning lead time improved from 5 to 15 minutes with modern technology
- Violent tornadoes (EF4-EF5) comprise <1% of events but cause majority of fatalities
- Challenges include satellite tornadoes, QLCS events, rapid intensification, nocturnal occurrence
- Mobile radar observations measure record 301 mph winds validating EF5+ potential