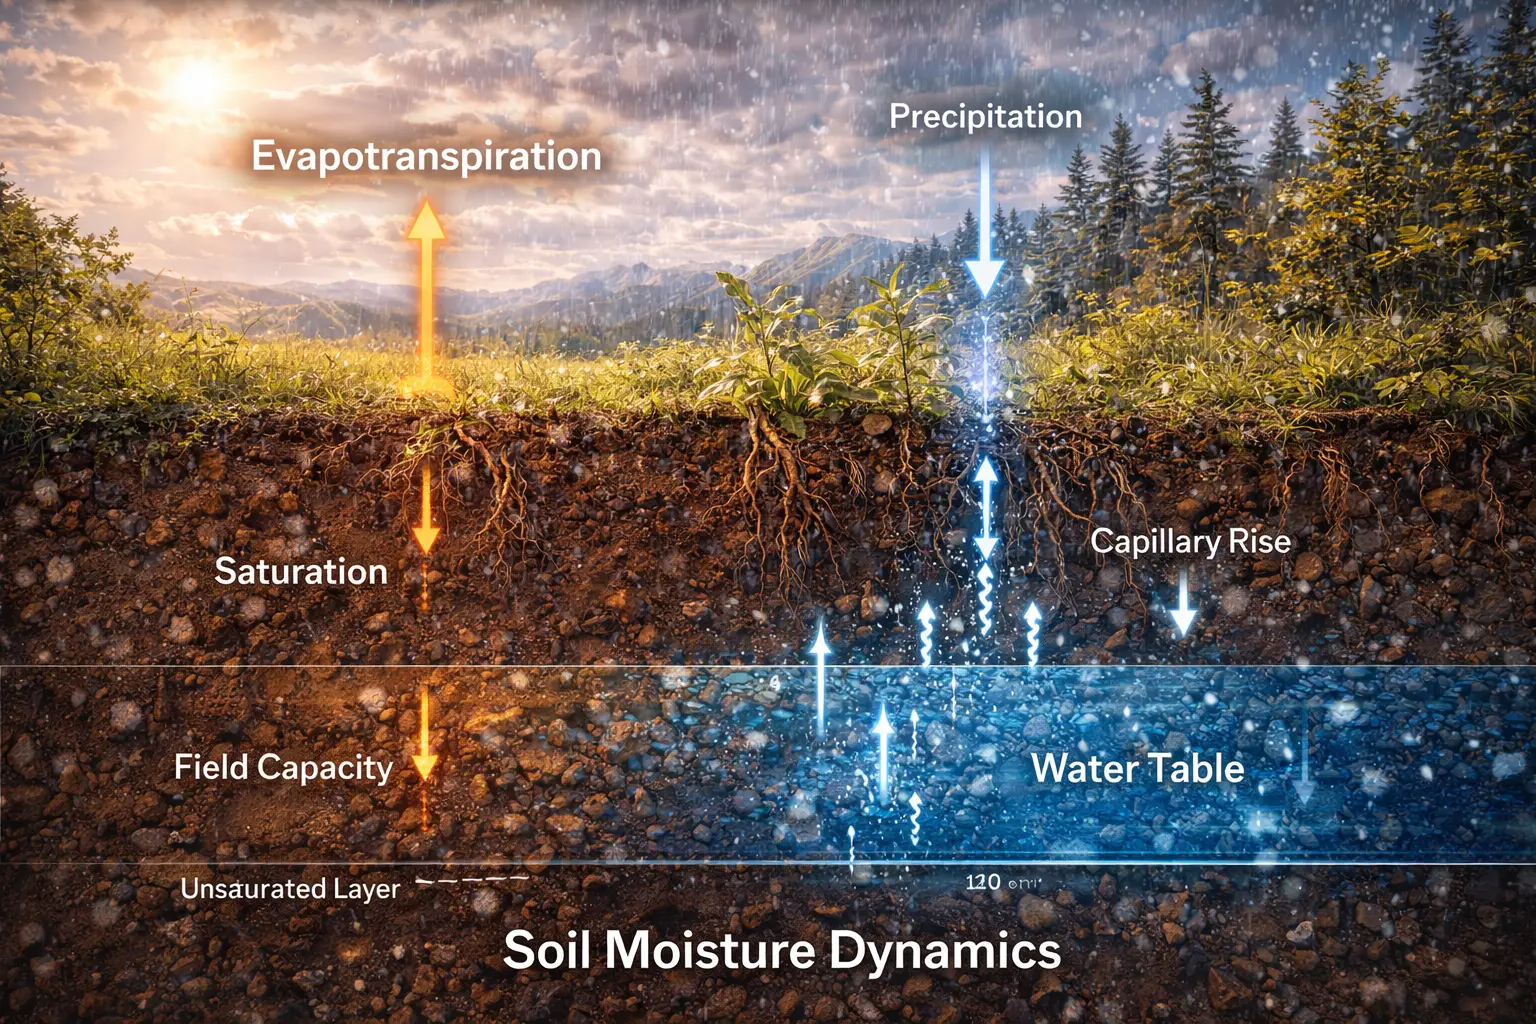
Soil Moisture Dynamics
Soil moisture controls plant water stress, runoff generation, and evaporation. This model builds a simple water balance model: precipitation inputs, evapotranspiration and drainage outputs, with storage limited by field capacity and wilting point. We'll track soil moisture over time and calculate water stress effects on plants.
Prerequisites: water balance, soil water potential, field capacity, wilting point
1. The Question
How much water is available to plants, and when do they experience drought stress?
Rainfall adds water to soil. Plants extract it through roots. Gravity drains excess water downward. The balance determines:
- Soil moisture content — how wet the soil is
- Plant water stress — whether plants can meet transpiration demand
- Runoff generation — when soil is saturated, rain becomes runoff
- Groundwater recharge — deep drainage replenishes aquifers
The mathematical question: How do we model soil moisture dynamics from precipitation, evapotranspiration, and drainage?
2. The Conceptual Model
Soil Water Balance
The root zone is the soil layer where most roots extract water (typically 0–1 m depth).
Water balance equation:
\[\frac{dS}{dt} = P - ET - D - R\]Where (all in mm/day or mm/time):
- $S$ = soil moisture storage (mm)
- $P$ = precipitation (mm/day)
- $ET$ = evapotranspiration (mm/day)
- $D$ = drainage (deep percolation, mm/day)
- $R$ = runoff (surface flow, mm/day)
Storage limits:
- Maximum storage (field capacity): $S_{\text{FC}}$
- Minimum usable storage (wilting point): $S_{\text{WP}}$
Key Soil Moisture States
Saturation ($S_{\text{sat}}$):
All pore space filled with water. Typical: 40–60% of soil volume.
Field capacity ($S_{\text{FC}}$):
Water held against gravity after ~2 days of drainage. Typical: 25–45% volume.
This is the practical maximum for agricultural modelling.
Wilting point ($S_{\text{WP}}$):
Plants cannot extract more water (high tension required). Typical: 10–25% volume.
Below this, plants wilt permanently.
Plant-available water (PAW):
\[\text{PAW} = S_{\text{FC}} - S_{\text{WP}}\]Typical values (for 1 m root zone):
- Sandy soil: PAW ≈ 50–100 mm
- Loam: PAW ≈ 150–200 mm
- Clay: PAW ≈ 150–250 mm
Water Stress Factor
As soil dries, plants experience stress. Define a water stress coefficient (0 ≤ K_s ≤ 1):
\[K_s = \begin{cases} 1 & \text{if } S > S_{\text{crit}} \\ \frac{S - S_{\text{WP}}}{S_{\text{crit}} - S_{\text{WP}}} & \text{if } S_{\text{WP}} < S < S_{\text{crit}} \\ 0 & \text{if } S \leq S_{\text{WP}} \end{cases}\]Where $S_{\text{crit}}$ is the threshold below which stress begins (typically 50–70% of PAW).
Actual evapotranspiration:
\[ET_{\text{actual}} = K_s \times ET_{\text{potential}}\]When stressed ($K_s < 1$), plants close stomata → transpiration decreases → photosynthesis decreases.
3. Building the Mathematical Model
Drainage
Drainage occurs when soil moisture exceeds field capacity.
Simple linear drainage:
\[D = \begin{cases} k_d (S - S_{\text{FC}}) & \text{if } S > S_{\text{FC}} \\ 0 & \text{if } S \leq S_{\text{FC}} \end{cases}\]Where $k_d$ is the drainage coefficient (day⁻¹, typically 0.1–1.0).
Fast drainage (sandy soil): $k_d \approx 1$ (excess drains in 1 day)
Slow drainage (clay): $k_d \approx 0.1$ (excess drains in 10 days)
Runoff
Runoff occurs when:
- Soil is at saturation ($S = S_{\text{sat}}$)
- Precipitation exceeds infiltration capacity
Simple bucket model:
\[R = \begin{cases} P - I_{\text{max}} & \text{if } P > I_{\text{max}} \text{ and } S = S_{\text{sat}} \\ 0 & \text{otherwise} \end{cases}\]Where $I_{\text{max}}$ is infiltration capacity (mm/day, typically 10–100 mm/day).
For simplicity, assume:
- Runoff occurs when $S$ would exceed $S_{\text{sat}}$
- Any excess precipitation becomes runoff
Complete Water Balance
At each time step:
- Add precipitation: $S’ = S + P \Delta t$
- Check for saturation excess runoff:
If $S’ > S_{\text{sat}}$: $R = S’ - S_{\text{sat}}$, set $S’ = S_{\text{sat}}$ - Calculate stress factor $K_s$ from current $S’$
- Remove ET: $S’’ = S’ - K_s ET_{\text{pot}} \Delta t$
- Calculate drainage:
If $S’’ > S_{\text{FC}}$: $D = k_d (S’’ - S_{\text{FC}})$ - Update storage: $S(t + \Delta t) = S’’ - D \Delta t$
- Enforce bounds: $S \geq 0$
4. Worked Example by Hand
Problem: A 1 m deep root zone has:
- Field capacity: $S_{\text{FC}} = 200$ mm
- Wilting point: $S_{\text{WP}} = 80$ mm
- Critical moisture: $S_{\text{crit}} = 140$ mm
- Initial storage: $S(0) = 150$ mm
- Drainage coefficient: $k_d = 0.5$ day⁻¹
Over 5 days:
- Day 1: $P = 0$ mm, $ET_{\text{pot}} = 5$ mm/day
- Day 2: $P = 0$ mm, $ET_{\text{pot}} = 5$ mm/day
- Day 3: $P = 40$ mm, $ET_{\text{pot}} = 4$ mm/day
- Day 4: $P = 0$ mm, $ET_{\text{pot}} = 6$ mm/day
- Day 5: $P = 0$ mm, $ET_{\text{pot}} = 6$ mm/day
Calculate $S$ at each day and determine stress.
Solution
Day 0 → 1:
$S_0 = 150$ mm
No stress: $K_s = 1$ (since $S_0 > S_{\text{crit}} = 140$)
$S_1 = 150 - 1 \times 5 = 145$ mm
Below FC, no drainage.
Day 1 → 2:
$S_1 = 145$ mm
No stress: $K_s = 1$
$S_2 = 145 - 1 \times 5 = 140$ mm
Day 2 → 3:
$S_2 = 140$ mm (exactly at critical point)
No stress yet: $K_s = 1$
After ET: $S’ = 140 - 4 = 136$ mm
Add rain: $S_3 = 136 + 40 = 176$ mm
Below FC (200 mm), no drainage.
Day 3 → 4:
$S_3 = 176$ mm
No stress: $K_s = 1$
$S_4 = 176 - 1 \times 6 = 170$ mm
Day 4 → 5:
$S_4 = 170$ mm
No stress: $K_s = 1$
$S_5 = 170 - 1 \times 6 = 164$ mm
Summary:
| Day | S (mm) | K_s | ET_actual (mm) | Notes |
|---|---|---|---|---|
| 0 | 150 | 1.0 | — | Initial |
| 1 | 145 | 1.0 | 5 | Drying |
| 2 | 140 | 1.0 | 5 | At critical |
| 3 | 176 | 1.0 | 4 | Rain recharged |
| 4 | 170 | 1.0 | 6 | Drying |
| 5 | 164 | 1.0 | 6 | Drying |
No water stress throughout this period (all $K_s = 1$).
If we continued without rain, stress would begin when $S < 140$ mm.
5. Computational Implementation
Below is an interactive soil moisture simulator.
Current moisture: mm
Field capacity: mm
Wilting point: mm
Water stress (Ks):
Plant available water: mm
Try this:
- Dry season: Watch moisture decline steadily, stress increases
- Wet season: Frequent rain keeps moisture near field capacity
- Sandy soil: Low water holding capacity, dries quickly
- Clay soil: High capacity, but also higher wilting point
- Add rain event: See immediate moisture spike
- Notice: When moisture drops below critical point (orange line), stress factor (Ks) decreases
Key insight: Plant-available water is the difference between field capacity and wilting point—not total moisture.
6. Interpretation
Drought Tolerance
Plants differ in critical moisture threshold:
Drought-tolerant (desert shrubs):
- Low $S_{\text{crit}}$ (can extract water at high tension)
- Deep roots access moisture below 1 m
- Stress begins near wilting point
Drought-sensitive (shallow-rooted crops):
- High $S_{\text{crit}}$ (stress begins early)
- Shallow roots (0–0.5 m)
- Require frequent irrigation
Irrigation Scheduling
Goal: Maintain $S > S_{\text{crit}}$ to avoid stress.
When to irrigate: When $S$ drops to $S_{\text{crit}}$ (typically 50–70% depletion of PAW).
How much: Refill to field capacity:
\[I = S_{\text{FC}} - S_{\text{current}}\]Example: FC = 200 mm, current = 120 mm:
\[I = 200 - 120 = 80 \text{ mm}\]Apply 80 mm of irrigation.
Groundwater Recharge
Recharge rate = drainage from root zone.
Annual recharge (arid region):
If $P = 200$ mm/year, $ET = 180$ mm/year:
Only 10% of precipitation recharges groundwater.
Humid region:
$P = 1000$ mm/year, $ET = 500$ mm/year:
50% recharges.
7. What Could Go Wrong?
Assuming Homogeneous Root Zone
Real soil has layers with different properties. Roots concentrate in topsoil (0–30 cm).
Layered model: Divide root zone into multiple layers, each with own water balance.
Ignoring Capillary Rise
In shallow water table conditions, water moves upward from saturated zone.
Effect: Reduces drainage, can maintain moisture even without rain.
Our model assumes deep water table (no capillary rise).
Neglecting Preferential Flow
Water can move rapidly through macropores (cracks, worm holes, root channels).
Effect: Fast drainage bypasses matrix → less storage → more runoff.
Clay soils with cracks: observed drainage faster than simple model predicts.
Constant ET Potential
Real $ET_{\text{pot}}$ varies with weather (solar radiation, humidity, wind from Model 18).
Dynamic model: Calculate $ET_{\text{pot}}$ daily from meteorological data (Penman-Monteith).
8. Extension: Soil Water Potential
Water potential ($\psi$, kPa or MPa) describes how tightly water is held.
Components:
- Matric potential ($\psi_m$): Tension from soil particles (negative)
- Gravitational potential ($\psi_g$): Elevation effect
- Osmotic potential ($\psi_o$): Dissolved salts
Total potential:
\[\psi = \psi_m + \psi_g + \psi_o\]Water moves from high to low potential (like heat from hot to cold).
Retention curve: Relates moisture content $\theta$ to matric potential $\psi_m$:
\[\psi_m = \psi_e \left(\frac{\theta}{\theta_s}\right)^{-b}\]Where:
- $\psi_e$ = air-entry potential (kPa)
- $\theta_s$ = saturated moisture content
- $b$ = pore-size distribution index
At field capacity: $\psi_m \approx -33$ kPa (1/3 bar)
At wilting point: $\psi_m \approx -1500$ kPa (15 bar)
Next model will integrate photosynthesis (Model 20) and water balance to model carbon cycling and Net Primary Productivity.
9. Math Refresher: Water Balance as Stock-Flow
Stock-Flow Diagram
Stock: $S$ (soil moisture, mm)
Inflows: $P$ (precipitation)
Outflows: $ET$ (evapotranspiration), $D$ (drainage), $R$ (runoff)
Differential equation:
\[\frac{dS}{dt} = P - ET - D - R\]Analogy:
- Bank account: Stock = balance, inflows = deposits, outflows = withdrawals
- Bathtub: Stock = water level, inflows = faucet, outflows = drain
Steady State
At equilibrium (long-term average):
\[\frac{dS}{dt} = 0 \implies P = ET + D + R\]All incoming water eventually leaves as ET, drainage, or runoff.
Seasonal variation: $S$ fluctuates but average is constant.
Summary
- Soil water balance: $dS/dt = P - ET - D - R$
- Field capacity ($S_{\text{FC}}$): Maximum practical storage after drainage
- Wilting point ($S_{\text{WP}}$): Minimum extractable water
- Plant-available water: PAW = $S_{\text{FC}} - S_{\text{WP}}$
- Water stress factor ($K_s$): Reduces ET when $S < S_{\text{crit}}$
- Drainage occurs when $S > S_{\text{FC}}$
- Runoff occurs when $S > S_{\text{sat}}$
- Sandy soils: Low PAW, fast drainage
- Clay soils: High PAW, slow drainage
- Irrigation timing: Apply water when $S$ reaches $S_{\text{crit}}$