Nitrogen Cycling and Limitation
Nitrogen limits productivity in most ecosystems. This model models the nitrogen cycle: mineralization from organic matter, nitrification, plant uptake, and how N availability constrains photosynthesis and NPP. We'll derive Michaelis- Menten uptake kinetics and couple N to the carbon cycle.
Prerequisites: michaelis menten, nutrient limitation, mineralization, uptake kinetics
1. The Question
Why do farmers add nitrogen fertilizer, and what happens if they add too much?
Nitrogen is essential for:
- Proteins (enzymes, including Rubisco for photosynthesis)
- Chlorophyll (light capture)
- Nucleic acids (DNA, RNA)
Plants need large amounts, but N is often limiting:
- Atmosphere is 78% N₂, but plants can’t use N₂ directly
- Soil mineral N (NH₄⁺, NO₃⁻) is often scarce
- Addition of N fertilizer → dramatic growth increase
The mathematical question: How do we model N cycling through soil, microbes, and plants, and how does N availability limit productivity?
2. The Conceptual Model
Nitrogen Pools
Five major pools:
- Organic N (soil organic matter):
- Locked in proteins, amino acids
- Not directly available to plants
- Largest pool
- Ammonium (NH₄⁺):
- Released by mineralization
- Plant-available
- Retained on soil particles (positively charged)
- Nitrate (NO₃⁻):
- Produced by nitrification
- Plant-available
- Mobile (leaches easily)
- Plant N:
- In leaves, roots, stems
- High N requirement for photosynthesis
- Atmospheric N₂:
- Only accessible via N fixation (legumes, lightning)
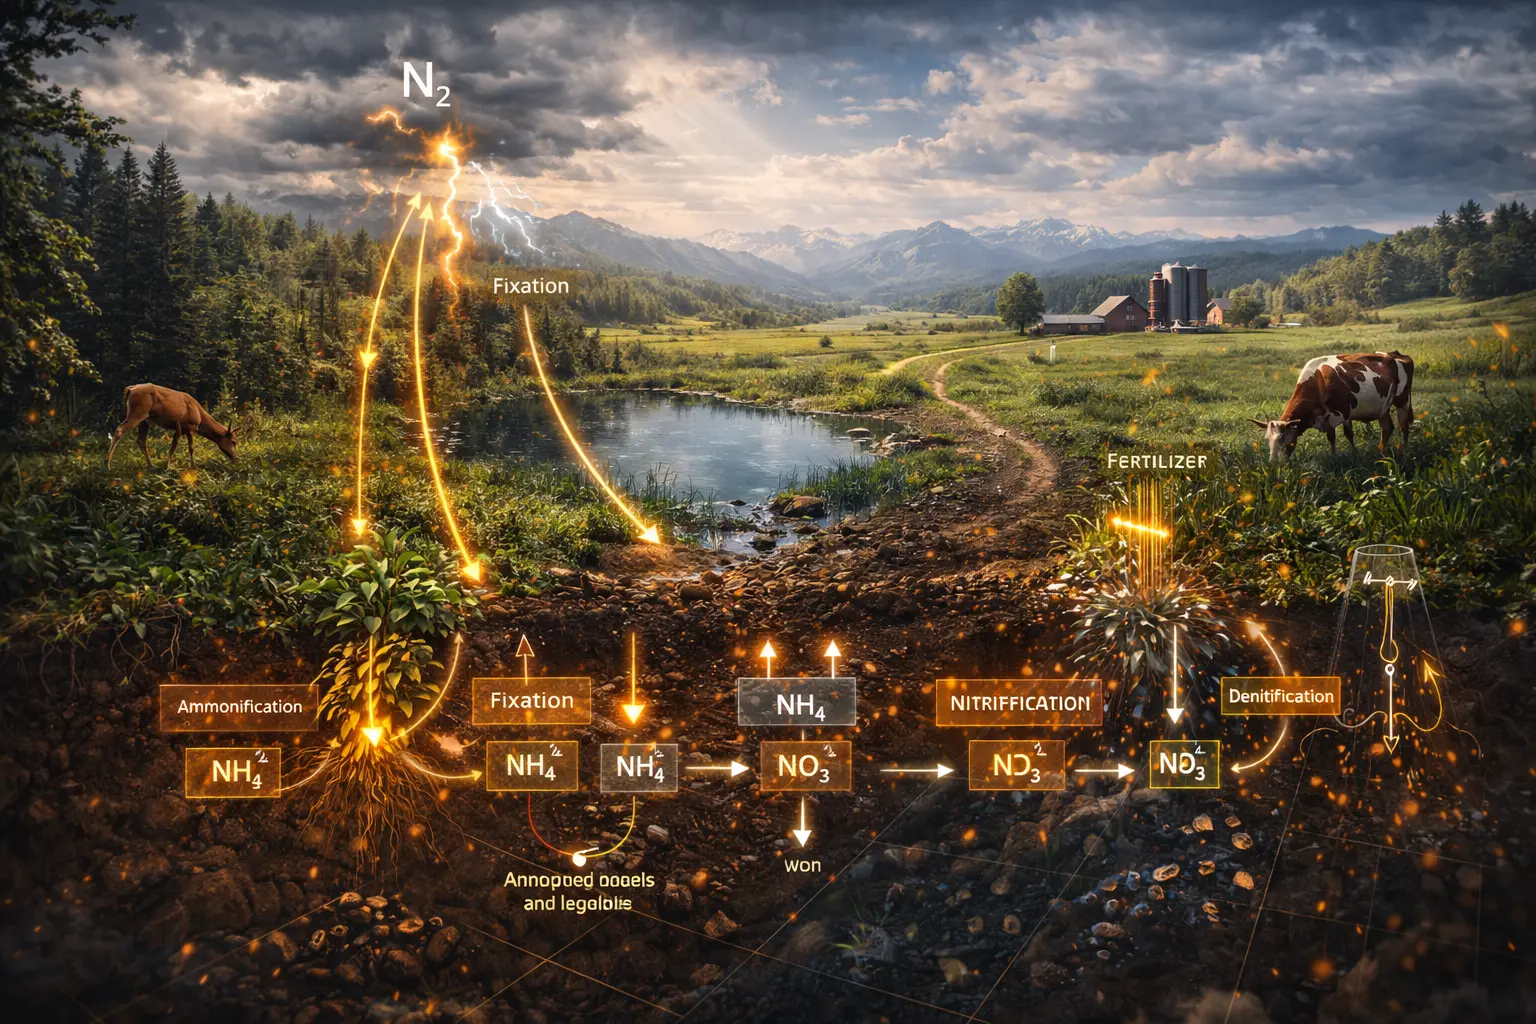
Key Processes
Mineralization:
Organic N → NH₄⁺ (via decomposition)
Nitrification:
NH₄⁺ → NO₃⁻ (via bacteria, aerobic)
Plant uptake:
NH₄⁺, NO₃⁻ → Plant N
Immobilization:
Microbes consume NH₄⁺, NO₃⁻ (compete with plants)
Leaching:
NO₃⁻ washes out of soil (water pollution)
Denitrification:
NO₃⁻ → N₂, N₂O (anaerobic, waterlogged soils)
3. Building the Mathematical Model
Mineralization
Mineralization rate tied to decomposition (Model 26):
\[M = \sum_i k_i C_i / \text{C:N}_i\]Where:
- $k_i$ = decay rate of pool $i$
- $C_i$ = carbon in pool $i$
- C:N$_i$ = carbon to nitrogen ratio
Example: Decomposing litter with C:N = 50, decay rate 1.0 year⁻¹, carbon 0.4 kg C/m²:
\[M = \frac{1.0 \times 0.4}{50} = 0.008 \text{ kg N/m}^2\text{/year}\]Net mineralization vs. immobilization:
- High C:N litter (> 25): Net immobilization (microbes consume more N than they release)
- Low C:N litter (< 25): Net mineralization (excess N released)
Nitrification
Nitrification rate:
\[N_{\text{nitr}} = k_{\text{nitr}} \times [\text{NH}_4^+] \times f(T) \times f(W)\]Where:
- $k_{\text{nitr}} \approx 0.1$–1.0 day⁻¹
- $f(T)$, $f(W)$ are temperature and moisture factors (as in Model 26)
Inhibited by:
- Low pH (< 5.5)
- Anaerobic conditions
- Low temperature
Plant Uptake
Michaelis-Menten kinetics:
\[U = U_{\max} \frac{[N]}{K_m + [N]}\]Where:
- $U$ = uptake rate (kg N/m²/year)
- $U_{\max}$ = maximum uptake rate
- $[N]$ = soil N concentration (NH₄⁺ + NO₃⁻)
- $K_m$ = half-saturation constant (mg N/L)
Shape:
- Low [N]: Uptake proportional to [N] (linear)
- High [N]: Uptake saturates at $U_{\max}$ (enzyme-limited)
Typical values:
- $U_{\max} \approx$ 0.02–0.05 kg N/m²/year (crops)
- $K_m \approx$ 1–10 mg N/L
N Limitation of NPP
Nitrogen use efficiency:
\[\text{NUE} = \frac{\text{NPP}}{N_{\text{uptake}}}\]Units: kg C per kg N
Typical: NUE ≈ 40–100 (need ~10–25 g N per kg C produced)
N-limited NPP:
\[\text{NPP}_{\text{actual}} = \min(\text{NPP}_{\text{potential}}, \text{NUE} \times U)\]If N uptake is low, NPP is reduced below potential (light-saturated) value.
Coupled C-N Model
Plant C:N ratio varies by tissue:
- Leaves: C:N ≈ 20–40
- Wood: C:N ≈ 200–500
- Roots: C:N ≈ 40–80
N requirement for growth:
\[N_{\text{demand}} = \frac{\text{NPP}}{\text{C:N}_{\text{plant}}}\]If $U < N_{\text{demand}}$, growth is N-limited.
4. Worked Example by Hand
Problem: A crop field has:
- Soil organic N: 5 kg N/m² with C:N = 12
- Decomposition rate: $k = 0.05$ year⁻¹
- Soil mineral N: [NH₄⁺] = 10 mg/L, [NO₃⁻] = 20 mg/L
- Plant uptake: $U_{\max} = 0.03$ kg N/m²/year, $K_m = 5$ mg N/L
- Plant C:N = 25
(a) Calculate mineralization rate
(b) Calculate plant N uptake
(c) Calculate maximum NPP supported by N
(d) Is the crop N-limited?
Solution
(a) Mineralization
Assuming SOM has C:N = 12 and total SOM carbon is:
\[C_{\text{SOM}} = N_{\text{SOM}} \times \text{C:N} = 5 \times 12 = 60 \text{ kg C/m}^2\] \[M = \frac{k \times C_{\text{SOM}}}{\text{C:N}} = \frac{0.05 \times 60}{12} = 0.25 \text{ kg N/m}^2\text{/year}\](b) Plant uptake
Total mineral N concentration:
\[[N] = 10 + 20 = 30 \text{ mg N/L}\] \[U = U_{\max} \frac{[N]}{K_m + [N]} = 0.03 \times \frac{30}{5 + 30}\] \[= 0.03 \times \frac{30}{35} = 0.03 \times 0.857 = 0.026 \text{ kg N/m}^2\text{/year}\](c) Maximum NPP from N
\[\text{NPP}_{\max} = U \times \text{C:N} = 0.026 \times 25 = 0.65 \text{ kg C/m}^2\text{/year}\](d) N limitation
If light-saturated NPP potential is > 0.65 kg C/m²/year, crop is N-limited.
Typical crop potential: 1–2 kg C/m²/year → Yes, N-limited (can only achieve ~50% of potential).
Adding fertilizer (increase [N] to 60 mg/L):
\[U = 0.03 \times \frac{60}{5 + 60} = 0.028 \text{ kg N/m}^2\text{/year}\]Small increase because already near saturation ($K_m = 5$ is low).
5. Computational Implementation
Below is an interactive nitrogen cycle simulator.
Mineral N: mg N/L
Plant N uptake: kg N/m²/year
NPP (N-limited): kg C/m²/year
Leaching loss: kg N/m²/year
Try this:
- Add fertilizer: Mineral N increases → uptake increases → NPP increases
- Natural forest: Low decomposition → low mineralization → N-limited
- Fertilized crop: High mineral N → near-maximum uptake → high NPP
- High C:N ratio: Less N released per unit C decomposed → lower mineralization
- Notice: NPP tracks mineral N availability with Michaelis-Menten saturation
Key insight: N availability controls productivity in most terrestrial ecosystems. Fertilizer works by relieving N limitation.
6. Interpretation
Why Ecosystems Are N-Limited
N₂ is abundant (78% of atmosphere) but unavailable to most organisms.
N fixation pathways:
- Biological: Legumes with Rhizobium bacteria (~100 kg N/ha/year)
- Industrial: Haber-Bosch process for fertilizer
- Lightning: Converts N₂ to NO₃⁻ (minor)
N losses:
- Leaching: NO₃⁻ washes to groundwater
- Denitrification: Anaerobic bacteria convert NO₃⁻ → N₂, N₂O
- Volatilization: NH₃ gas loss
Result: Inputs < Outputs in many ecosystems → chronic N limitation.
Fertilizer and Eutrophication
Excess fertilizer leads to:
- Runoff → rivers, lakes
- Eutrophication: Algal blooms, oxygen depletion, fish kills
- Dead zones: Gulf of Mexico, Baltic Sea
Nitrous oxide (N₂O):
- Greenhouse gas (300× more potent than CO₂)
- Produced by nitrification and denitrification
- Agricultural soils are major source
C:N Stoichiometry
Redfield ratio (aquatic): C:N:P = 106:16:1
Terrestrial plants: C:N ≈ 20–50 (higher than aquatic)
Herbivore constraint:
- Plant C:N = 40
- Herbivore C:N = 6
- Must excrete excess C or retain N
Decomposer constraint:
- Microbe C:N = 8
- High C:N litter → immobilize soil N
- Low C:N litter → release N
7. What Could Go Wrong?
Assuming Unlimited N
Models without N often overestimate NPP in:
- Boreal forests (cold, slow mineralization)
- Tropical forests on old soils (N leached over millennia)
- Grasslands (fire volatilizes N)
Including N can reduce predicted NPP by 20–50%.
Ignoring N₂O Emissions
Nitrification and denitrification produce N₂O (greenhouse gas).
Emission factor: ~1–2% of applied fertilizer N becomes N₂O.
Global warming potential of agricultural N₂O is significant.
Constant C:N Ratios
Real plant C:N varies with:
- N availability: High N → lower C:N (more protein)
- Tissue type: Leaves < roots < wood
- Species: Legumes lower than grasses
Better models: Allow flexible C:N based on N supply.
Neglecting Phosphorus
Tropical soils are often P-limited, not N-limited.
Old, weathered soils: P leached or bound to iron/aluminum oxides.
Full model needs both N and P cycles.
8. Extension: N Saturation
Chronic N deposition (from air pollution) can lead to N saturation:
Symptoms:
- Nitrate leaching increases
- Soil acidification (nitrification produces H⁺)
- Aluminum toxicity
- Forest decline
Threshold: ~10–20 kg N/ha/year deposition
Regions affected: Europe, eastern US, parts of China
9. Math Refresher: Michaelis-Menten Kinetics
Derivation from Enzyme Kinetics
Enzyme-substrate reaction:
\[E + S \xrightarrow{k_1} ES \xrightarrow{k_2} E + P\]At steady state:
\[V = \frac{V_{\max}[S]}{K_m + [S]}\]Where:
- $V_{\max} = k_2[E]_{\text{total}}$ (maximum rate)
- $K_m = (k_{-1} + k_2)/k_1$ (half-saturation)
Same form for nutrient uptake:
- $S$ → nutrient concentration
- $E$ → uptake transporters in roots
Properties
Low [S]: $V \approx \frac{V_{\max}}{K_m}[S]$ (linear, first-order)
High [S]: $V \approx V_{\max}$ (saturated, zero-order)
At $[S] = K_m$: $V = V_{\max}/2$ (half-maximum rate)
Summary
- Nitrogen limits productivity in most terrestrial ecosystems
- Key processes: Mineralization (organic → NH₄⁺), Nitrification (NH₄⁺ → NO₃⁻), Plant uptake, Leaching, Denitrification
- Michaelis-Menten uptake: $U = U_{\max}[N]/(K_m + [N])$
- N requirement for growth: NPP / C:N ratio
- Low soil C:N → net mineralization; high C:N → immobilization
- Fertilizer increases mineral N → increases uptake → increases NPP
- Excess N causes eutrophication and N₂O emissions
- Most ecosystems are N-limited; tropical old soils may be P-limited
- N cycling couples tightly to carbon cycle (C:N stoichiometry)