Digital Elevation Models as Functions
Terrain has structure: it rises and falls continuously across space. We can represent elevation as a mathematical function z = f(x, y), where every point in the horizontal plane has a unique elevation. In practice, we discretize this into a raster grid. This model bridges continuous mathematics and digital data.
Prerequisites: functions of two variables, discretization, finite differences
1. The Question
How do we represent the shape of the land mathematically?
A landscape is not at all just flat. Mountains rise, valleys sink, hillslopes tilt. Every point on the surface has an elevation above some reference (usually sea level).
If we know the coordinates $(x, y)$ of a point on the ground, can we write down a function that gives us the elevation $z$?
Yes — and this is the foundation of terrain analysis, hydrology, viewshed modelling, and landslide prediction.
The mathematical question: How do we go from a continuous surface to a computable representation?
2. The Conceptual Model
Terrain as a Function
Imagine standing at a point with coordinates $(x, y)$ measured in meters east and north from some origin. The elevation at that point is $z$.
Mathematically:
\[z = f(x, y)\]This is a function of two variables:
- Input: A position $(x, y)$ in the horizontal plane
- Output: Elevation $z$ at that position
Examples of terrain functions:
- Flat plane: $z = 100$ (elevation is constant everywhere)
- Tilted plane: $z = 500 + 0.05x - 0.02y$ (uniform slope)
- Cone: $z = 1000 - \sqrt{x^2 + y^2}$ (peak at origin, decreasing radially)
- Saddle: $z = x^2 - y^2$ (up in one direction, down in the perpendicular direction)
Real terrain is more complex, but the concept is the same: elevation is determined by position.
From Continuous to Discrete
In reality, we can’t write down a simple algebraic formula for real terrain. Instead, we measure elevation at many points and store the values in a grid.
Digital Elevation Model (DEM): A raster grid where each cell contains the elevation of the terrain at that location.
Grid structure:
- Rows and columns define positions
- Cell size (resolution) determines how finely we sample the terrain (e.g., 10 m × 10 m cells)
- Elevation values are stored as numbers (integers or floating point)
Example: A 5×5 DEM (rows from north to south, columns from west to east):
110  115  120  125  130
108  112  118  124  129
105  110  115  121  127
103  108  113  118  123
100  105  110  115  120
Each number is the elevation (in meters) at the center of that cell.
3. Building the Mathematical Model
Defining the Coordinate System
To turn a grid into a function, we need to define:
- Origin: Where is $(x, y) = (0, 0)$?
- Cell size: $\Delta x$ (east-west), $\Delta y$ (north-south)
- Grid extent: How many rows and columns?
Standard convention:
- x increases eastward
- y increases northward
- Origin is typically the southwest corner of the grid
If the grid has $m$ rows and $n$ columns, with cell size $\Delta x = \Delta y = d$:
\(x_j = x_0 + j \cdot d, \quad j = 0, 1, \ldots, n-1\) \(y_i = y_0 + i \cdot d, \quad i = 0, 1, \ldots, m-1\)
The elevation at grid cell $(i, j)$ is $z_{i,j}$.
From Grid Indices to Coordinates
Given a grid cell index $(i, j)$, the corresponding real-world coordinates are:
\[(x, y) = (x_0 + j \cdot d, \; y_0 + i \cdot d)\]Example: Grid with origin $(x_0, y_0) = (500000, 4500000)$ (UTM coordinates), cell size $d = 30$ m, cell $(i=2, j=3)$:
\(x = 500000 + 3 \times 30 = 500090 \text{ m}\) \(y = 4500000 + 2 \times 30 = 4500060 \text{ m}\)
Interpolating Between Grid Points
A DEM gives elevation only at grid cell centers. What about points between cells?
Bilinear interpolation: Given a point $(x, y)$ inside a grid cell, interpolate elevation using the four surrounding cell values.
Let the four corners have elevations $z_{00}, z_{01}, z_{10}, z_{11}$ at positions:
\[\begin{align} (x_0, y_0) &\rightarrow z_{00} \\ (x_0, y_1) &\rightarrow z_{01} \\ (x_1, y_0) &\rightarrow z_{10} \\ (x_1, y_1) &\rightarrow z_{11} \end{align}\]For a point $(x, y)$ with $x_0 < x < x_1$ and $y_0 < y < y_1$:
\[z(x, y) = (1 - s)(1 - t) z_{00} + s(1 - t) z_{10} + (1 - s)t z_{01} + st z_{11}\]Where:
\[s = \frac{x - x_0}{x_1 - x_0}, \quad t = \frac{y - y_0}{y_1 - y_0}\]This creates a piecewise continuous surface — smooth within each cell, potentially discontinuous at cell boundaries.
4. Worked Example by Hand
Problem: A 3×3 DEM has cell size 10 m and origin at $(x_0, y_0) = (0, 0)$. Elevations (in meters):
Row 0:  100  105  110
Row 1:  102  107  112
Row 2:  105  110  115
(a) What is the elevation at grid cell $(i=1, j=2)$?
(b) What are the real-world coordinates of this cell center?
(c) Estimate the elevation at point $(x, y) = (15, 5)$ using bilinear interpolation.
Solution
(a) Elevation at cell (1, 2)
Row 1, column 2: $z_{1,2} = 112$ m
(b) Coordinates of cell center
\(x = x_0 + j \cdot d = 0 + 2 \times 10 = 20 \text{ m}\) \(y = y_0 + i \cdot d = 0 + 1 \times 10 = 10 \text{ m}\)
Cell center: (20, 10) m
(c) Interpolation at (15, 5)
Point $(15, 5)$ lies between cells:
- $x$: between column 1 ($x = 10$) and column 2 ($x = 20$)
- $y$: between row 0 ($y = 0$) and row 1 ($y = 10$)
Four corner elevations:
- $(10, 0)$: $z = 105$ (row 0, col 1)
- $(20, 0)$: $z = 110$ (row 0, col 2)
- $(10, 10)$: $z = 107$ (row 1, col 1)
- $(20, 10)$: $z = 112$ (row 1, col 2)
Interpolation parameters:
\[s = \frac{15 - 10}{20 - 10} = \frac{5}{10} = 0.5\] \[t = \frac{5 - 0}{10 - 0} = \frac{5}{10} = 0.5\]Interpolated elevation:
\[\begin{align} z(15, 5) &= (1 - 0.5)(1 - 0.5)(105) + (0.5)(1 - 0.5)(110) \\ &\quad + (1 - 0.5)(0.5)(107) + (0.5)(0.5)(112) \\ &= 0.25 \times 105 + 0.25 \times 110 + 0.25 \times 107 + 0.25 \times 112 \\ &= 26.25 + 27.5 + 26.75 + 28 \\ &= 108.5 \text{ m} \end{align}\]Elevation at (15, 5): 108.5 m
5. Computational Implementation
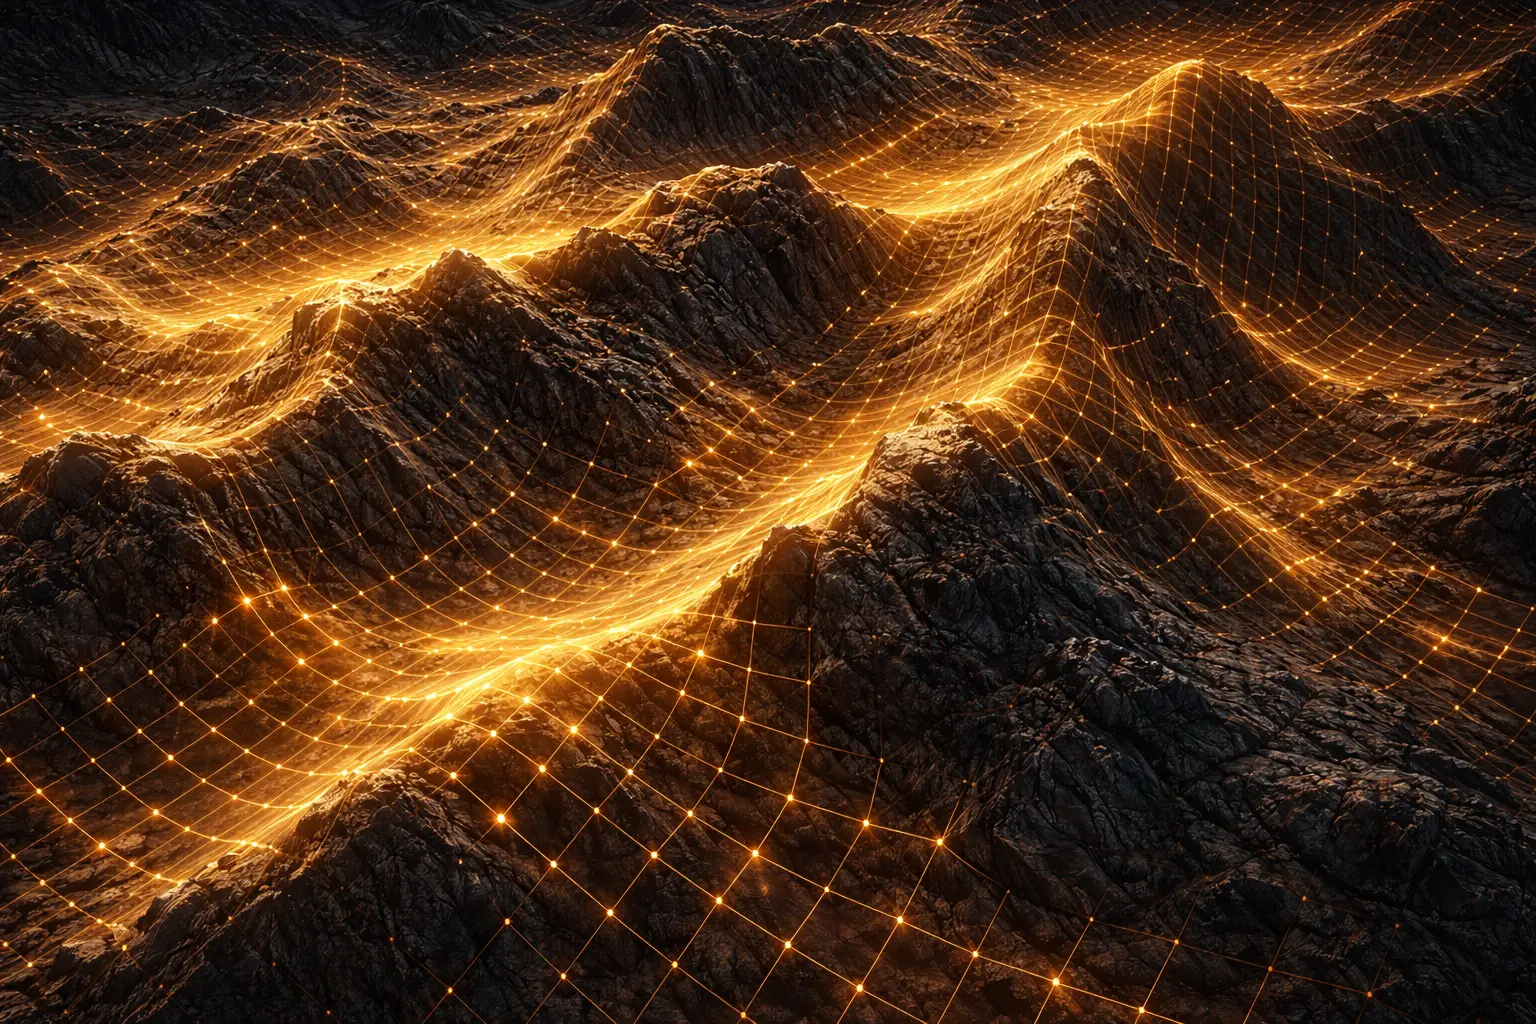
Below is an interactive 3D visualization of a synthetic DEM.
Each cell represents one grid point in the raster. Colour encodes elevation (blue = low, red = high). This top-down view is exactly how a DEM is stored: a 2D array of elevation values.
Try this:
- Cone: Radial symmetry, single peak
- Saddle: Up in one direction, down in perpendicular direction (mountain pass)
- Plane: Uniform slope (no curvature)
- Ridge: Linear high feature
- Valley: Linear low feature
- Increase resolution: Smoother surface, more cells, same terrain shape
- Decrease resolution: Coarser surface, blockier appearance
Key insight: The mathematical function is continuous, but the DEM is discrete. Higher resolution approximates the continuous surface better.
6. Interpretation
Resolution and Detail
Coarse DEM (90 m cells):
- Good for regional analysis
- Misses small features (gullies, terraces)
- Fast to process
Fine DEM (1 m cells):
- Captures detailed topography
- Required for local hydrology, erosion modelling
- Large file sizes, slower computation
Rule of thumb: Cell size should be smaller than the features you care about.
Vertical Accuracy vs. Horizontal Resolution
A DEM with 10 m horizontal resolution might have:
- ±1 m vertical accuracy (high-quality lidar)
- ±10 m vertical accuracy (older photogrammetry)
Don’t confuse the two. Resolution is spacing; accuracy is error.
Edge Effects
At the edge of a DEM, there are no neighboring cells beyond the boundary. Calculations requiring neighbors (slope, aspect) are undefined or require special handling (mirror, clamp, or mark as no-data).
7. What Could Go Wrong?
Confusing Row/Column with X/Y
Common error: Treating row index as x-coordinate.
Correct:
- Row index $i$ corresponds to y-coordinate (north-south)
- Column index $j$ corresponds to x-coordinate (east-west)
Always check your coordinate system convention.
Assuming Regular Grids
Not all DEMs are regular grids:
- Triangulated Irregular Networks (TINs): Points connected by triangles (better for sparse data)
- Irregular point clouds: Lidar before gridding
This model focuses on regular grids (rasters) because they’re simpler and more common.
Interpolation Artifacts
Bilinear interpolation creates a piecewise planar surface — each cell becomes a flat facet. This can introduce:
- Artificial terracing
- Discontinuous slopes at cell boundaries
More sophisticated interpolation (bicubic, splines) can smooth these, but at computational cost.
Coordinate Reference Systems
Real-world DEMs use projected coordinate systems (e.g., UTM) or geographic coordinates (latitude/longitude). Geographic coordinates are not uniform in distance — 1° longitude spans different distances at different latitudes.
Always check the CRS before doing distance-based calculations.
8. Extension: Functions of Two Variables in Calculus
A function $z = f(x, y)$ defines a surface in 3D space.
Partial derivatives measure how the surface changes when you move in one direction while holding the other constant:
\[\frac{\partial z}{\partial x} = \text{rate of change in the x-direction (eastward)}\] \[\frac{\partial z}{\partial y} = \text{rate of change in the y-direction (northward)}\]In terrain analysis:
- $\frac{\partial z}{\partial x}$ is the east-west slope component
- $\frac{\partial z}{\partial y}$ is the north-south slope component
Next model (Model 8) will show how to compute these from a DEM using finite differences and combine them into gradient and aspect.
9. Math Refresher: Functions of Two Variables
Notation
\[z = f(x, y)\]Read as: “z is a function of x and y.”
Example
\[f(x, y) = x^2 + y^2\]Evaluation:
- $f(3, 4) = 3^2 + 4^2 = 9 + 16 = 25$
- $f(0, 0) = 0$
- $f(-1, 2) = 1 + 4 = 5$
Level Curves (Contour Lines)
A level curve is the set of all $(x, y)$ points where $f(x, y)$ equals a constant.
Example: For $z = x^2 + y^2$, the level curve $z = 25$ is the circle $x^2 + y^2 = 25$ (radius 5).
In terrain, level curves are contour lines — lines of constant elevation.
Summary
- Terrain can be represented as a function $z = f(x, y)$
- A Digital Elevation Model (DEM) discretizes this function into a raster grid
- Grid cells have indices $(i, j)$ corresponding to coordinates $(x, y)$
- Bilinear interpolation estimates elevation between grid points
- Resolution (cell size) determines how finely the terrain is sampled
- Functions of two variables define surfaces; partial derivatives measure slope
- Real DEMs require careful attention to coordinate systems and interpolation methods