Refined Products Distribution
Alberta refines more petroleum products than any other Canadian province. The Edmonton refinery cluster — Strathcona, Scotford, and Co-op — supplies gasoline, diesel, and jet fuel to markets from Vancouver to Thunder Bay. This essay maps the refined products pipeline system, derives the batch scheduling mathematics, and traces how a litre of Edmonton-refined diesel reaches a pump in British Columbia.
Prerequisites: Throughput rate, batch scheduling, inventory turnover, terminal capacity
1. The Question
How does refined fuel get from an Alberta refinery to a gas station in Vancouver, and what does the pipeline logistics look like mathematically?
The public conversation about Alberta pipelines centres almost entirely on crude oil export. But there is a second pipeline system — smaller, less visible, and less discussed — that moves refined petroleum products westward, eastward, and northward from Alberta’s refinery cluster.
Gasoline, diesel, and jet fuel are not crude oil. They are manufactured products, produced by cracking and distilling crude oil at refineries, and they must reach consumers in specific grades and specifications. Moving them efficiently — without contaminating one product grade with another, without running terminals dry, and without holding excessive inventory — is a logistics problem as much as a pipeline problem.
This essay traces that system: the Edmonton refineries that anchor it, the Trans Mountain refined products line that carries fuel to Vancouver, the regional distribution terminals, and the batch scheduling mathematics that keeps the supply chain synchronized.
2. The Conceptual Model
The Edmonton refinery cluster
Alberta has four operating refineries, all located in the Edmonton region:
| Refinery | Owner | Location | Capacity (bbl/d) | Primary Products |
|---|---|---|---|---|
| Strathcona Refinery | Imperial Oil | Strathcona County | 195,000 | Gasoline, diesel, jet fuel, asphalt |
| Scotford Upgrader/Refinery | Shell/Dow | Fort Saskatchewan | 100,000 | SCO, diesel, chemicals |
| Co-op Refinery Complex | Federated Co-op | Regina SK | 145,000 | Gasoline, diesel, propane |
| North West Redwater | NWR Upgrading | Sturgeon County | 79,000 | Diesel (ultra-low sulphur), diluent |
The North West Redwater refinery (Sturgeon Refinery) is notable: it was specifically designed to process oil sands bitumen and produce ultra-low sulphur diesel, partially funded by Alberta Petroleum Marketing Commission bitumen royalties. It entered full operations in the early 2020s and represents Alberta’s most recent major refinery investment.
The Edmonton cluster is geographically positioned to receive crude from the oil sands via pipeline (the Enbridge system and Aurora Pipeline) and to distribute products both westward into BC and eastward across the prairies. Its location is not incidental — it sits at the hub of the Alberta pipeline system for the same reasons Fort Saskatchewan sits at the NGL hub.
What refined products pipelines carry
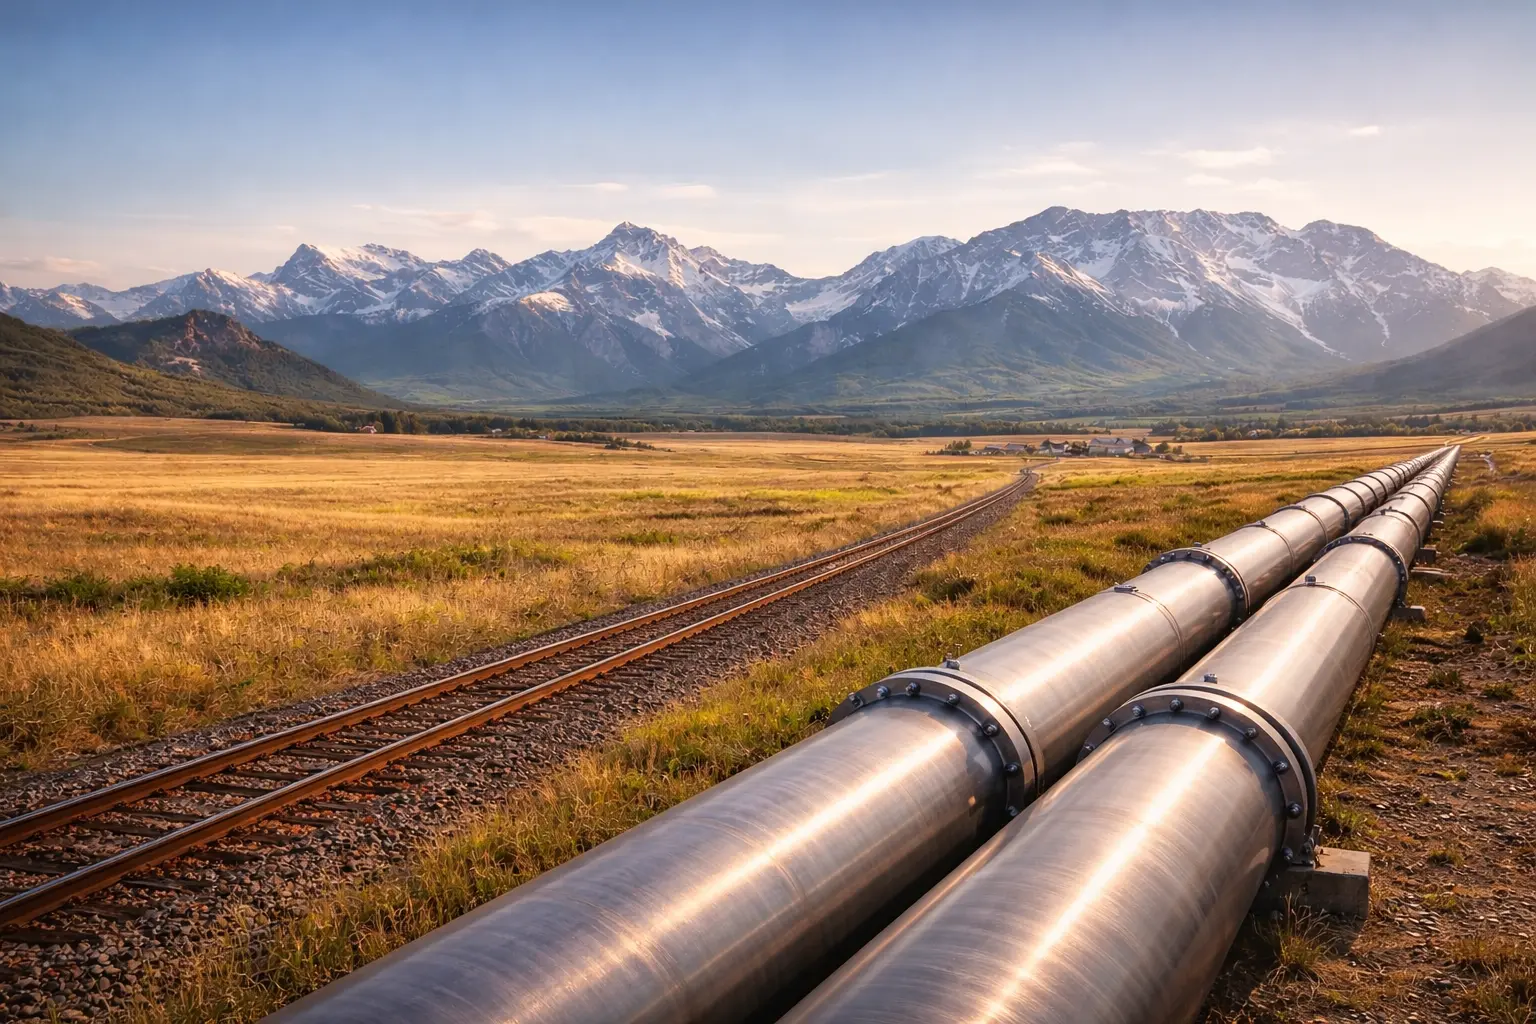
Refined products pipelines differ from crude pipelines in one critical operational way: they carry multiple products in sequence through the same pipe, rather than a single commodity. A typical refined products pipeline might carry, in succession:
- Regular unleaded gasoline (87 octane)
- Premium gasoline (91 octane)
- Ultra-low sulphur diesel (ULSD)
- Jet fuel (Jet A)
- Aviation gasoline (AvGas)
These products cannot be mixed without degrading both. The pipeline therefore operates in batches — defined slugs of each product, injected sequentially. At the receiving terminal, the pipeline operator monitors the arriving product quality and diverts each batch into its designated tank as it arrives.
At the interface between two batches, a small volume of mixed product (the interface or transmix) forms due to turbulent mixing in the pipe. This transmix is collected separately, typically downgraded to diesel or sent to a reprocessor. Minimizing transmix — keeping interfaces tight — is an operational and economic objective.
The Trans Mountain refined products system
The Trans Mountain pipeline carries both crude oil (via the expansion line) and refined products (via the original line). The refined products segment runs from Edmonton to Burnaby, BC, delivering fuel to terminals that serve the Vancouver market and the BC Interior.
Key refined products delivery points on the Trans Mountain system:
- Kamloops terminal: regional distribution hub for BC Interior
- Burnaby terminal: primary receiving terminal for Metro Vancouver
- Sumas terminal: distribution for Fraser Valley
- Vancouver Airport: jet fuel delivery from the Burnaby terminal via truck and dedicated airport line
The Trans Mountain refined products line has a capacity of approximately 300,000 bbl/d (combined crude and products). The products allocation varies with crude nominations and seasonal demand patterns.
Terminal logistics: the receiving end
At a receiving terminal, the logistics challenge is managing:
- Batch arrival timing — products arrive on a schedule determined by the pipeline operator’s batch sequence
- Tank inventory — each product grade must maintain enough inventory to supply local demand without running dry between pipeline deliveries
- Truck loading — tanker trucks load at the terminal for last-mile delivery to retail stations, industrial customers, and airports
The terminal is the interface between the wholesale pipeline system and the retail distribution network. Its storage capacity determines how long it can sustain supply if the pipeline is interrupted; its truck loading rate determines how quickly it can respond to demand spikes.
3. The Mathematical Model
Batch scheduling: volume and timing
For a pipeline of cross-sectional area $A$ and flow velocity $v$, the time for a batch of volume $V_b$ to traverse a pipe segment of length $L$ is:
\[t_{\text{transit}} = \frac{L}{v} + \frac{V_b}{Q}\]where $Q = Av$ is the volumetric flow rate. More usefully, if we define the line fill (total volume of the pipe) as:
\[V_{\text{line}} = A \cdot L = \frac{\pi D^2}{4} \cdot L\]then the transit time for any batch is:
\[t_{\text{transit}} = \frac{V_{\text{line}} + V_b}{Q}\]The scheduling constraint is that batches must be sized large enough that the interface volume (transmix) is a small fraction of total batch volume. Industry practice is to keep interface volumes below 0.1–0.5% of batch volume.
Interface (transmix) volume
The volume of mixed product at the interface between two batches in a turbulent pipeline is approximately:
\[V_{\text{interface}} \approx 11.75 \cdot D^{1.1} \cdot L^{0.5}\]where $D$ is pipe diameter (inches) and $L$ is pipe length (miles), giving $V_{\text{interface}}$ in barrels. This empirical formula (the Cola equation, widely used in pipeline scheduling) shows that interface volume grows with pipe diameter and with the square root of pipe length.
For a 16-inch pipeline over 600 miles (roughly Trans Mountain refined products line to Burnaby):
\[V_{\text{interface}} \approx 11.75 \times 16^{1.1} \times 600^{0.5}\] \[\approx 11.75 \times 21.1 \times 24.5 \approx 6{,}080 \text{ bbl}\]This means approximately 6,080 barrels of transmix form at each product-to-product interface. To keep transmix below 1% of batch volume, the minimum batch size is:
\[V_{b,\min} = \frac{V_{\text{interface}}}{0.01} = 608{,}000 \text{ bbl}\]In practice, batches are sized to balance transmix minimization against market demand patterns and terminal storage capacity.
Terminal inventory turnover
The days of supply held at a terminal is:
\[\text{Days of supply} = \frac{V_{\text{storage}}}{D_{\text{demand}}}\]where $V_{\text{storage}}$ is working storage capacity (bbl) and $D_{\text{demand}}$ is daily demand (bbl/d). Terminals are designed to hold 7–14 days of supply for each product grade — enough to bridge the gap between pipeline batch arrivals while providing buffer against supply disruptions.
The inventory turnover rate is:
\[\text{Turnover} = \frac{D_{\text{demand}} \times 365}{V_{\text{storage}}}\]A high turnover rate (>30×/year) indicates a lean, efficient terminal; a low rate (<15×/year) indicates either excess storage or sluggish demand.
Throughput utilization
As with crude pipelines:
\[U = \frac{Q_{\text{actual}}}{Q_{\text{nameplate}}} \times 100\%\]For refined products pipelines, utilization has a seasonal signature: gasoline demand peaks in summer (driving season); diesel peaks in winter (heating and freight); jet fuel tracks air travel which peaks in summer. A single pipeline carrying all three products must manage this asynchronous demand pattern through batch sequencing and terminal inventory management.
4. Worked Example by Hand
How long does a diesel batch take to travel from Edmonton to Burnaby?
Trans Mountain refined products line: approximately 1,150 km (715 miles), 16-inch diameter, operating at approximately 200,000 bbl/d combined throughput.
Step 1 — Line fill:
\[V_{\text{line}} = \frac{\pi \times (16 \times 0.0254)^2}{4} \times 1{,}150{,}000 \text{ m}\] \[D = 16 \times 0.0254 = 0.4064 \text{ m}\] \[A = \frac{\pi \times 0.4064^2}{4} = \frac{\pi \times 0.1652}{4} \approx 0.1297 \text{ m}^2\] \[V_{\text{line}} = 0.1297 \times 1{,}150{,}000 \approx 149{,}155 \text{ m}^3 \approx 938{,}000 \text{ bbl}\]Step 2 — Flow velocity:
At 200,000 bbl/d total throughput (assuming products at ~50%, so 100,000 bbl/d on the products allocation):
\[Q = 100{,}000 \text{ bbl/d} \times 0.158987 \text{ m}^3/\text{bbl} \div 86{,}400 \text{ s/d} = 0.184 \text{ m}^3/\text{s}\] \[v = \frac{Q}{A} = \frac{0.184}{0.1297} \approx 1.42 \text{ m/s}\]Step 3 — Transit time for the line fill volume:
\[t_{\text{line}} = \frac{V_{\text{line}}}{Q} = \frac{149{,}155 \text{ m}^3}{0.184 \text{ m}^3/\text{s}} = 810{,}625 \text{ s} \approx 9.4 \text{ days}\]A diesel batch injected at Edmonton takes approximately 9–10 days to arrive at Burnaby. This transit time determines the minimum planning horizon for BC fuel supply management.
Step 4 — Interface volume:
\[V_{\text{interface}} \approx 11.75 \times 16^{1.1} \times 715^{0.5}\]$$16^{1.1} \approx 21.1 \qquad 715^{0.5} \approx 26.7$$
\[V_{\text{interface}} \approx 11.75 \times 21.1 \times 26.7 \approx 6{,}625 \text{ bbl}\]At a diesel batch size of 300,000 bbl (a typical large batch), the transmix fraction is:
\[\frac{6{,}625}{300{,}000} \approx 2.2\%\]This 2.2% must be collected, segregated, and reprocessed — a real but manageable operational cost built into the pipeline tariff.
Step 5 — Burnaby terminal days of supply:
Burnaby terminal storage capacity: approximately 800,000 bbl (across all products). Metro Vancouver daily demand: approximately 60,000 bbl/d (gasoline + diesel + jet fuel combined).
\[\text{Days of supply} = \frac{800{,}000}{60{,}000} \approx 13.3 \text{ days}\]With a 9–10 day transit time, the Burnaby terminal maintains roughly 3–4 days of buffer above the pipeline transit time — adequate for minor disruptions but thin for a prolonged outage.
5. Computational Implementation
# Foundation Implementation
# Refined products pipeline: batch scheduling, interface volume, terminal inventory

import math

BBL_TO_M3 = 0.158987
M3_TO_BBL = 6.2898
PI = math.pi

def line_fill_bbl(diameter_in: float, length_km: float) -> float:
    """Total volume contained in a pipeline segment (bbl)."""
    d_m = diameter_in * 0.0254
    a_m2 = PI * d_m**2 / 4
    vol_m3 = a_m2 * length_km * 1000
    return vol_m3 * M3_TO_BBL

def flow_velocity_ms(flow_bbl_d: float, diameter_in: float) -> float:
    """Mean flow velocity (m/s)."""
    d_m = diameter_in * 0.0254
    a_m2 = PI * d_m**2 / 4
    q_m3s = flow_bbl_d * BBL_TO_M3 / 86400
    return q_m3s / a_m2

def transit_time_days(diameter_in: float,
                       length_km: float,
                       flow_bbl_d: float) -> float:
    """Time for product to traverse the pipeline (days)."""
    lf = line_fill_bbl(diameter_in, length_km)
    q_bbl_d = flow_bbl_d
    return lf / q_bbl_d

def interface_volume_bbl(diameter_in: float, length_miles: float) -> float:
    """
    Empirical Cola equation: transmix volume at product-to-product interface.
    diameter_in : pipe diameter (inches)
    length_miles: pipe length (miles)
    Returns     : interface volume (bbl)
    """
    return 11.75 * (diameter_in ** 1.1) * (length_miles ** 0.5)

def min_batch_size_bbl(diameter_in: float,
                        length_miles: float,
                        max_transmix_pct: float = 1.0) -> float:
    """Minimum batch size to keep transmix below max_transmix_pct."""
    vi = interface_volume_bbl(diameter_in, length_miles)
    return vi / (max_transmix_pct / 100)

def days_of_supply(storage_bbl: float, daily_demand_bbl_d: float) -> float:
    """Days of supply at a terminal."""
    return storage_bbl / daily_demand_bbl_d

def inventory_turnover(daily_demand_bbl_d: float, storage_bbl: float) -> float:
    """Annual inventory turnover rate."""
    return daily_demand_bbl_d * 365 / storage_bbl

# --- Alberta refined products pipelines ---
PIPELINES = {
    "Trans Mountain (products)": {
        "diameter_in": 16,
        "length_km": 1147,
        "length_miles": 713,
        "flow_bbl_d": 100_000,
        "route": "Edmonton → Kamloops → Burnaby BC"
    },
    "Enbridge Mainline (products)": {
        "diameter_in": 12,
        "length_km": 3104,
        "length_miles": 1929,
        "flow_bbl_d": 55_000,
        "route": "Edmonton → Winnipeg → Sarnia ON"
    },
    "Rangeland Pipeline": {
        "diameter_in": 10,
        "length_km": 800,
        "length_miles": 497,
        "flow_bbl_d": 28_000,
        "route": "Edmonton → Calgary → Lethbridge"
    },
}

print("=== Alberta Refined Products Pipeline Network ===\n")
print(f"{'Pipeline':<30} {'D(in)':>6} {'Length':>8} {'Flow':>10} {'Transit':>9} {'Line fill':>11}")
print(f"{'':30} {'':6} {'(km)':>8} {'(bbl/d)':>10} {'(days)':>9} {'(000 bbl)':>11}")
print("-" * 80)

for name, p in PIPELINES.items():
    lf = line_fill_bbl(p["diameter_in"], p["length_km"])
    tt = transit_time_days(p["diameter_in"], p["length_km"], p["flow_bbl_d"])
    v = flow_velocity_ms(p["flow_bbl_d"], p["diameter_in"])
    print(f"{name:<30} {p['diameter_in']:>6} {p['length_km']:>8,} "
          f"{p['flow_bbl_d']:>10,} {tt:>9.1f} {lf/1000:>11.0f}")

print(f"\n=== Interface and Batch Sizing: Trans Mountain Products ===\n")
d_in = 16
l_miles = 713
vi = interface_volume_bbl(d_in, l_miles)
min_batch = min_batch_size_bbl(d_in, l_miles, max_transmix_pct=1.0)
print(f"  Interface volume (Cola equation): {vi:,.0f} bbl")
print(f"  Minimum batch size (1% transmix): {min_batch:,.0f} bbl")
print(f"  Minimum batch size (0.5% transmix): {min_batch_size_bbl(d_in, l_miles, 0.5):,.0f} bbl")

print(f"\n=== Burnaby Terminal: Inventory Analysis ===\n")
terminals = {
    "Burnaby (Metro Vancouver)": {"storage_bbl": 800_000, "demand_bbl_d": 60_000},
    "Kamloops (BC Interior)":    {"storage_bbl": 180_000, "demand_bbl_d": 14_000},
    "Calgary (Rangeland hub)":   {"storage_bbl": 450_000, "demand_bbl_d": 38_000},
    "Edmonton (origin)":         {"storage_bbl": 1_200_000, "demand_bbl_d": 45_000},
}
print(f"{'Terminal':<30} {'Storage':>10} {'Demand':>10} {'Days supply':>12} {'Turnover':>10}")
print(f"{'':30} {'(bbl)':>10} {'(bbl/d)':>10} {'':>12} {'(x/yr)':>10}")
print("-" * 75)
for name, t in terminals.items():
    dos = days_of_supply(t["storage_bbl"], t["demand_bbl_d"])
    to = inventory_turnover(t["demand_bbl_d"], t["storage_bbl"])
    print(f"{name:<30} {t['storage_bbl']:>10,} {t['demand_bbl_d']:>10,} {dos:>12.1f} {to:>10.1f}")
Professional Implementation
# Professional Implementation
# Refined products supply chain: full batch scheduler and terminal inventory model

import math
from dataclasses import dataclass, field
from typing import Optional
from enum import Enum

BBL_TO_M3 = 0.158987
PI = math.pi

class ProductGrade(Enum):
    REGULAR_GAS = "Regular Unleaded (87)"
    PREMIUM_GAS = "Premium Unleaded (91)"
    ULSD = "Ultra-Low Sulphur Diesel"
    JET_A = "Jet A Fuel"
    HEATING_OIL = "Heating Oil"

@dataclass
class ProductBatch:
    grade: ProductGrade
    volume_bbl: float
    injection_date_day: int   # day of year

    def transmix_at_trailing_interface(self,
                                        diameter_in: float,
                                        length_miles: float) -> float:
        """Cola equation: transmix at trailing edge of this batch."""
        return 11.75 * (diameter_in ** 1.1) * (length_miles ** 0.5)

    def transmix_fraction(self, diameter_in: float, length_miles: float) -> float:
        vi = self.transmix_at_trailing_interface(diameter_in, length_miles)
        return vi / self.volume_bbl


@dataclass
class RefinedProductsPipeline:
    name: str
    diameter_in: float
    length_km: float
    throughput_bbl_d: float
    origin: str
    destination: str
    batches: list[ProductBatch] = field(default_factory=list)

    @property
    def length_miles(self) -> float:
        return self.length_km / 1.60934

    @property
    def diameter_m(self) -> float:
        return self.diameter_in * 0.0254

    @property
    def cross_section_m2(self) -> float:
        return PI * self.diameter_m**2 / 4

    @property
    def line_fill_m3(self) -> float:
        return self.cross_section_m2 * self.length_km * 1000

    @property
    def line_fill_bbl(self) -> float:
        return self.line_fill_m3 / BBL_TO_M3

    @property
    def velocity_ms(self) -> float:
        q_m3s = self.throughput_bbl_d * BBL_TO_M3 / 86400
        return q_m3s / self.cross_section_m2

    @property
    def transit_time_days(self) -> float:
        return self.line_fill_bbl / self.throughput_bbl_d

    def arrival_day(self, batch: ProductBatch) -> float:
        """Day of year when batch arrives at destination."""
        return batch.injection_date_day + self.transit_time_days

    def schedule_report(self):
        print(f"\n  Pipeline: {self.name}")
        print(f"  Route   : {self.origin} → {self.destination}")
        print(f"  Specs   : {self.diameter_in}\" × {self.length_km:,.0f} km")
        print(f"  Flow    : {self.throughput_bbl_d:,} bbl/d | "
              f"v = {self.velocity_ms:.2f} m/s | "
              f"Transit = {self.transit_time_days:.1f} days")
        print(f"  Line fill: {self.line_fill_bbl:,.0f} bbl")

        if self.batches:
            print(f"\n  Batch Schedule:")
            print(f"  {'Grade':<35} {'Volume':>10} {'Inject day':>11} "
                  f"{'Arrive day':>11} {'Transmix%':>10}")
            print(f"  {'-'*78}")
            for b in self.batches:
                arr = self.arrival_day(b)
                tmx = b.transmix_fraction(self.diameter_in, self.length_miles) * 100
                print(f"  {b.grade.value:<35} {b.volume_bbl:>10,.0f} "
                      f"{b.injection_date_day:>11} {arr:>11.1f} {tmx:>9.2f}%")


@dataclass
class Terminal:
    name: str
    location: str
    storage_by_grade: dict   # ProductGrade -> storage_bbl
    daily_demand: dict       # ProductGrade -> bbl/d

    @property
    def total_storage_bbl(self) -> float:
        return sum(self.storage_by_grade.values())

    @property
    def total_demand_bbl_d(self) -> float:
        return sum(self.daily_demand.values())

    def days_of_supply(self, grade: ProductGrade) -> float:
        storage = self.storage_by_grade.get(grade, 0)
        demand = self.daily_demand.get(grade, 1)
        return storage / demand

    def turnover(self, grade: ProductGrade) -> float:
        storage = self.storage_by_grade.get(grade, 1)
        demand = self.daily_demand.get(grade, 0)
        return demand * 365 / storage

    def report(self):
        print(f"\n  Terminal: {self.name} ({self.location})")
        print(f"  {'Product':<35} {'Storage':>10} {'Demand':>10} "
              f"{'Days supply':>12} {'Turnover':>10}")
        print(f"  {'-'*78}")
        for grade in self.storage_by_grade:
            dos = self.days_of_supply(grade)
            to = self.turnover(grade)
            flag = " ⚠" if dos < 7 else ""
            print(f"  {grade.value:<35} "
                  f"{self.storage_by_grade[grade]:>10,} "
                  f"{self.daily_demand.get(grade, 0):>10,} "
                  f"{dos:>12.1f}{flag} {to:>10.1f}")
        print(f"  {'TOTAL':<35} {self.total_storage_bbl:>10,.0f} "
              f"{self.total_demand_bbl_d:>10,.0f} "
              f"{self.total_storage_bbl/self.total_demand_bbl_d:>12.1f}")


# --- Build Trans Mountain products schedule ---
tm_products = RefinedProductsPipeline(
    "Trans Mountain (Products Line)",
    diameter_in=16, length_km=1147,
    throughput_bbl_d=100_000,
    origin="Edmonton AB", destination="Burnaby BC"
)

tm_products.batches = [
    ProductBatch(ProductGrade.ULSD,        300_000, injection_date_day=1),
    ProductBatch(ProductGrade.REGULAR_GAS, 280_000, injection_date_day=4),
    ProductBatch(ProductGrade.JET_A,       120_000, injection_date_day=7),
    ProductBatch(ProductGrade.PREMIUM_GAS,  90_000, injection_date_day=9),
]

tm_products.schedule_report()

# --- Burnaby terminal ---
burnaby = Terminal(
    "Burnaby Terminal",
    "Burnaby BC",
    storage_by_grade={
        ProductGrade.REGULAR_GAS: 320_000,
        ProductGrade.PREMIUM_GAS:  80_000,
        ProductGrade.ULSD:        280_000,
        ProductGrade.JET_A:       120_000,
    },
    daily_demand={
        ProductGrade.REGULAR_GAS: 28_000,
        ProductGrade.PREMIUM_GAS:  7_000,
        ProductGrade.ULSD:        18_000,
        ProductGrade.JET_A:        7_000,
    }
)

burnaby.report()
6. Visualization
Figure 1 — Alberta Refinery Capacity by Product Output
Figure 2 — Refined Products Pipeline Transit Times from Edmonton
Figure 3 — Terminal Days of Supply: Burnaby
Figure 4 — Seasonal Demand Pattern by Product
Figure 5 — Batch Sequence: Trans Mountain Products Line
7. Interpretation
Alberta refines more than it consumes locally
Alberta’s combined refinery capacity of approximately 374,000 bbl/d substantially exceeds the province’s own refined products demand of roughly 180,000 bbl/d. The surplus — roughly 194,000 bbl/d — moves outward by pipeline and truck to supply British Columbia, Saskatchewan, Manitoba, and northern markets. Alberta is a net exporter of refined products as well as crude oil and natural gas.
This is a point that tends to be lost in pipeline discussions focused exclusively on crude export: the province’s refinery investment means that value is added domestically before product leaves. A barrel of bitumen refined into diesel in Strathcona County generates more provincial economic activity than the same barrel exported as dilbit — though the refinery’s economics depend on the crude-to-product spread (the crack spread), which fluctuates independently of crude prices.
The 9–10 day transit time is a supply chain design parameter
The approximately 9–10 day transit time from Edmonton to Burnaby is not a limitation — it is a design parameter around which the entire BC supply chain is built. Terminals maintain 11–15 days of supply precisely because they know the replenishment pipeline is 9–10 days away. This is routine supply chain management at continental scale, operating reliably with modest inventory buffers.
The figure becomes significant only during extended pipeline outages. The Trans Mountain system’s various disruptions over its history — including the Burnaby Mountain spill response in 2007 and subsequent inspection-related shutdowns — demonstrated that BC fuel supply can sustain roughly two weeks of normal demand from terminal inventory before supply-side measures (emergency trucking, marine imports, demand management) become necessary.
Seasonal demand mismatch is the operational challenge
Figure 4 shows that gasoline peaks in summer while diesel peaks in winter, and jet fuel tracks the summer travel season. A single pipeline carrying all three products must batch them in ratios that anticipate seasonal demand shifts weeks in advance — because of the 9–10 day transit time, the product mix injected today arrives at Burnaby in roughly two weeks.
This means refined products pipeline operators are essentially running a demand-forecasting problem embedded in a physical logistics system. Getting the batch sequence wrong leaves terminals short of one product while holding excess inventory of another — both conditions that generate costs.
The Sturgeon Refinery’s strategic logic
The North West Redwater / Sturgeon Refinery deserves specific attention. It was built with partial funding from Alberta’s bitumen royalty system — the Alberta Petroleum Marketing Commission takes bitumen in-kind and supplies it to the refinery at a defined price, allowing the province to capture upgrading margins that would otherwise flow to refineries in the U.S. Midwest. The refinery’s primary output is ultra-low sulphur diesel — a high-value product with strong demand from the transportation sector — and its design specifically targets oil sands feedstock that no other Canadian refinery was built to handle.
Its commissioning delays and cost overruns were significant and widely reported. But its operational logic is straightforward: it is an attempt to move one step further up the value chain from raw bitumen export.
8. What Could Go Wrong?
The Cola equation is empirical
The transmix volume formula used here is an industry-standard approximation. Actual interface volumes depend on the specific products being batched, the flow regime (Reynolds number), pipe wall roughness, and any changes in flow rate during transit. For scheduling purposes, operators use proprietary batch tracking software that monitors product quality at the receiving end in real time, not formula estimates.
Demand forecasting errors
The 9–10 day transit time means that batch injection decisions must anticipate demand roughly two weeks out. Demand forecast errors accumulate in terminal inventory — a colder-than-expected November draws diesel inventories down faster than the batch sequence planned for; a wet summer reduces gasoline demand relative to forecast. These mismatches are managed through supplementary trucking, emergency resequencing, and inter-terminal transfers, but at increased cost.
The crack spread drives refinery economics
The profitability of refining — and therefore the incentive to maintain refinery capacity — depends on the crack spread: the difference between the value of refined products (gasoline, diesel, jet fuel) and the cost of crude feedstock. Crack spreads fluctuate with product market conditions independently of crude oil prices. A narrow crack spread can make it uneconomical to run a refinery at full capacity, reducing the refined products available for pipeline injection regardless of pipeline capacity.
9. Summary
Alberta’s refined products pipeline system is the downstream complement to its crude export infrastructure. The key quantitative facts:
- Refinery capacity: approximately 374,000 bbl/d across four Edmonton-area refineries; local demand is roughly 180,000 bbl/d, making Alberta a net refined products exporter of approximately 194,000 bbl/d
- Transit time: Edmonton to Burnaby takes approximately 9–10 days at normal throughput; Burnaby terminal maintains 11–15 days of supply — a 3–4 day buffer above the pipeline transit time
- Batch scheduling: the Cola equation gives interface volume as $\approx 11.75 \times D^{1.1} \times L^{0.5}$ barrels; for Trans Mountain’s 16-inch, 713-mile route, this is approximately 6,600 bbl per interface — about 2% of a typical 300,000-bbl batch
- Seasonal demand: gasoline peaks in summer, diesel in winter, jet fuel in summer — the pipeline batch sequence must anticipate these asynchronous patterns two weeks in advance
- Sturgeon Refinery: Alberta’s newest refinery, designed to capture upgrading margin from oil sands bitumen, producing ultra-low sulphur diesel as its primary product
The mathematics of refined products logistics — batch scheduling, transmix estimation, terminal inventory design — shows that the supply chain from Edmonton refinery to Vancouver pump is a precisely engineered system, not an improvised one. Its reliability is a function of careful design with appropriate inventory buffers, not of pipeline overcapacity.
Math Refresher
Why pipeline volume scales with diameter squared
A circular pipe has cross-sectional area $A = \pi r^2 = \pi D^2/4$. Line fill volume is $V = A \times L$. So:
\[V \propto D^2 \times L\]Doubling the diameter quadruples the line fill — and quadruples the volume of product in transit at any given time. This means a larger-diameter pipeline has a longer transit time for the same flow rate, all else equal. But it also moves far more product per unit time, so in practice larger pipes are built with higher throughput to maintain acceptable transit times.
The crack spread in one equation
\[\text{Crack spread} = P_{\text{products}} - P_{\text{crude}}\]A common approximation is the 3-2-1 crack spread: 3 barrels of crude produce 2 barrels of gasoline and 1 barrel of diesel. If gasoline is $100/bbl, diesel is $110/bbl, and crude is $75/bbl:
\[\text{3-2-1 spread} = \frac{2 \times 100 + 1 \times 110}{3} - 75 = \frac{310}{3} - 75 = 103.3 - 75 = \$28.3/\text{bbl}\]This spread compensates the refiner for operating costs, capital recovery, and profit. When it narrows below ~$10–15/bbl, refinery margins are thin and throughput reductions become economic.
Sources and Data Notes
| Source | Used For |
|---|---|
| Canada Energy Regulator, Petroleum Product Supply (2024) | Refinery capacity, product volumes, demand |
| Imperial Oil, Annual Report (2023) | Strathcona refinery capacity and operations |
| Trans Mountain Corporation, Operations Overview (2024) | Products line capacity and route |
| North West Redwater Partnership, Sturgeon Refinery Update (2024) | Capacity, product slate, commissioning |
| Enbridge, Products Pipeline System Overview | Eastern refined products corridor |
| Cola, A.L. (1965), Pipeline batch interface calculations | Transmix empirical formula derivation |
| Menon, E.S., Liquid Pipeline Hydraulics (2004) | Batch scheduling theory and line fill equations |
| Government of Alberta, Alberta’s Refined Petroleum Products Market (2022) | Supply/demand balance, terminal infrastructure |
All refinery capacity figures are nameplate. Actual throughput varies with feedstock availability, turnaround scheduling, and market conditions. Terminal storage estimates are approximate.
References
Canada Energy Regulator. 2024. Pipeline Profiles: Trans Mountain Expanded System. Calgary: CER. https://apps.cer-rec.gc.ca/PPS/en/pipeline-profiles/trans-mountain-expanded-system
Canadian Fuels Association. n.d. “Co-op’s Regina Refinery Is Indisputably Local.” Ottawa: Canadian Fuels Association. https://www.canadianfuels.ca/co-ops-regina-refinery-is-indisputably-local/
Co-operative Refinery Complex. n.d. Co-op Refinery Complex. Regina: Federated Co-operatives Limited. https://www.fcl.crs/our-business/refinery
Imperial Oil. 2024. “Strathcona Refinery.” Calgary: Imperial Oil. https://www.imperialoil.ca/company/operations/strathcona
Menon, E. Shashi. 2004. Liquid Pipeline Hydraulics. New York: Marcel Dekker. (No public URL available — standard pipeline engineering reference.)
Natural Resources Canada. 2024. Energy Fact Book 2024–2025. Ottawa: NRCan. https://energy-information.canada.ca/en/energy-facts
North West Redwater Partnership. 2024. The Sturgeon Refinery. Sturgeon County: NWR. https://nwrsturgeonrefinery.com/about/about-us/
Statistics Canada. 2025. “The Trans Mountain Pipeline Is Delivering.” Ottawa: Statistics Canada. https://www.statcan.gc.ca/o1/en/plus/8439-trans-mountain-pipeline-delivering
Trans Mountain Corporation. 2024. Trans Mountain Pipeline System. Calgary: Trans Mountain. https://www.transmountain.com/pipeline-system