Stochastic Streamflow and Drought Risk
A 100-year drought is not a drought that happens once per century — it is a drought with a 1% probability of occurring in any given year. The distinction matters enormously for infrastructure design. This essay derives the flow duration curve and exceedance probability framework, explains why streamflow must be modelled stochastically to capture multi-year drought risk, implements the Thomas-Fiering autoregressive model to generate synthetic flow sequences, defines drought indices (SPI, PDSI), and applies reliability-resilience- vulnerability metrics to water supply systems.
Prerequisites: probability and exceedance, log normal distribution, autoregressive models, reliability theory
On October 3, 1988, the Colorado River below Hoover Dam dropped to its lowest recorded flow in more than 50 years — a direct consequence of a multi-year drought that had drawn Lake Mead to 39% of capacity. The event was not unprecedented: tree-ring records show that the 20th century was one of the wettest in the past 1,200 years of Colorado River history, meaning the entire reservoir system was sized on an anomalously wet baseline. The same pattern applies to almost every major river basin in western North America: the instrumental record is too short to characterise the worst droughts that will occur over a 100-year infrastructure design life.
The solution is stochastic hydrology: generating many synthetic streamflow sequences — each statistically consistent with the historical record but covering the full range of natural variability — and evaluating reservoir performance across all of them.
1. The Question
How do we characterise the statistical properties of streamflow? What is the return period of a drought, and how is it calculated? How do we generate synthetic flow sequences for risk analysis? How do we measure drought severity? And what metrics quantify water supply system reliability?
2. The Conceptual Model
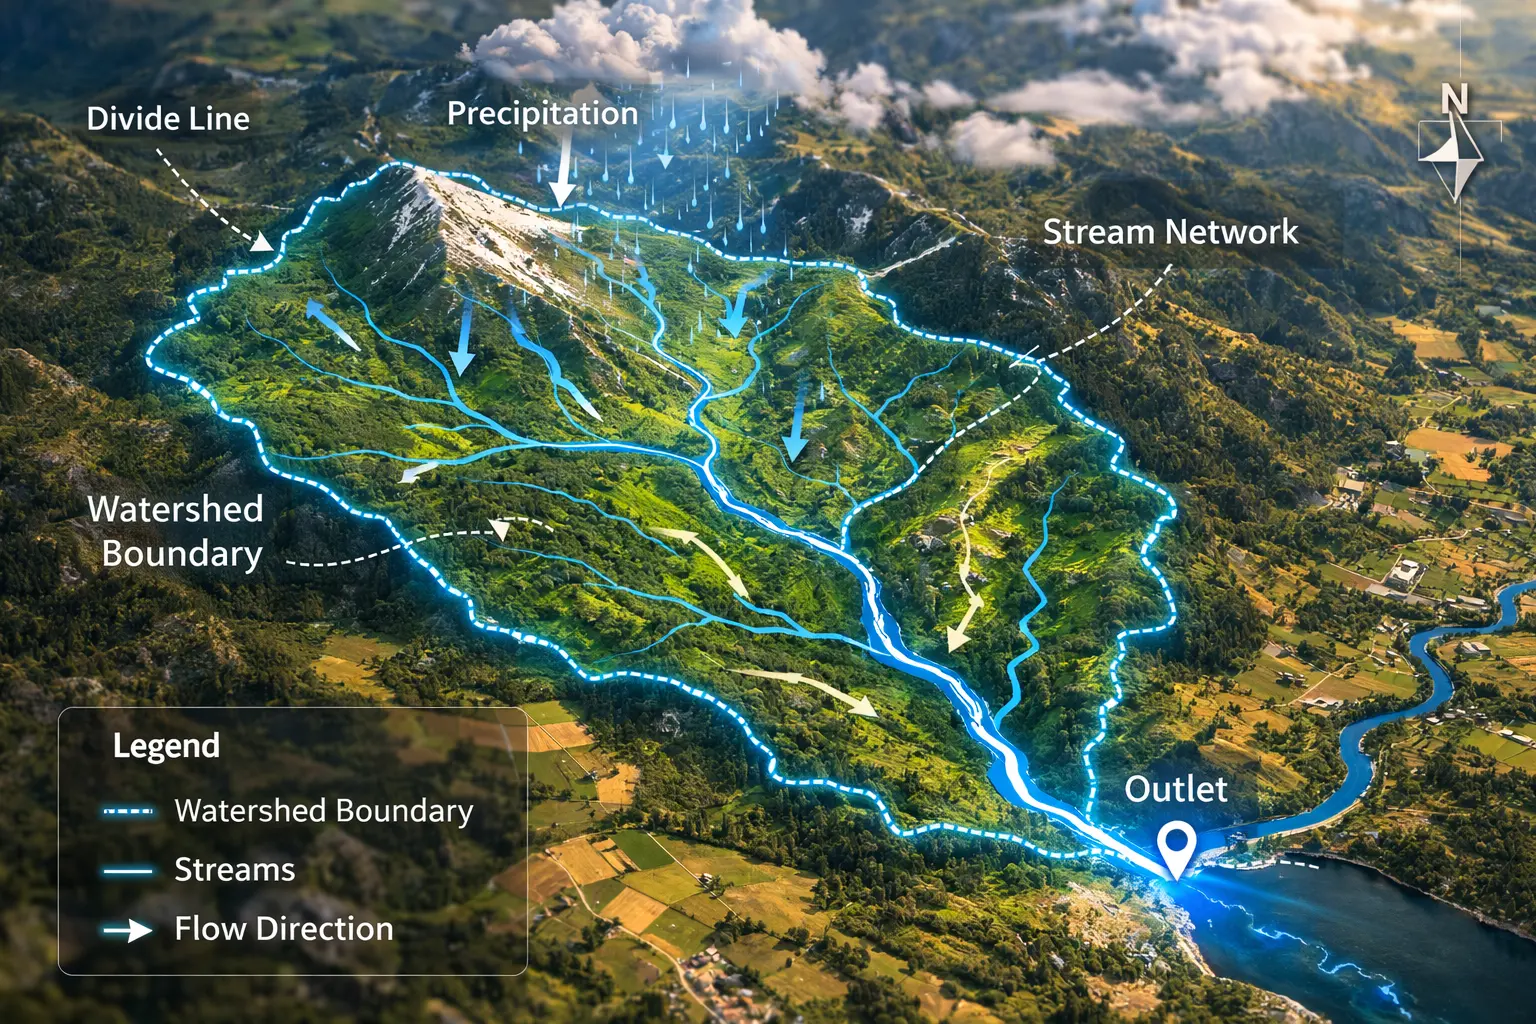
Streamflow is neither random nor deterministic. It is a stochastic process: driven by random precipitation and temperature, shaped by watershed memory (soils, groundwater, snowpack), and exhibiting both persistence (wet years tend to follow wet years) and seasonality. Capturing these properties in a statistical model allows generating arbitrarily long synthetic records that preserve the observed mean, variance, autocorrelation, and seasonal patterns — while exploring flow sequences more severe than any in the historical record.
3. Building the Mathematical Model
3.1 Flow Duration Curve
The flow duration curve (FDC) is the cumulative frequency distribution of streamflow — it shows the fraction of time that flow equals or exceeds any given value. Construction:
- Sort the $n$ observed daily (or monthly) flow values in descending order: $Q_{(1)} \geq Q_{(2)} \geq \ldots \geq Q_{(n)}$
- Assign exceedance probability to rank $i$: $P_{\text{exceed}}(i) = i/(n+1)$ (Weibull plotting position)
- Plot $Q_{(i)}$ against $P_{\text{exceed}}(i)$
Key percentiles:
| Percentile | Notation | Interpretation |
|---|---|---|
| $Q_{5}$ | 5% exceedance | Flood flow: exceeded only 5% of the time |
| $Q_{50}$ | 50% exceedance | Median flow |
| $Q_{90}$ | 90% exceedance | Low flow: only 10% of the time is flow this low or lower |
| $Q_{95}$ | 95% exceedance | Near-minimum flow: environmental flow standard |
The slope of the FDC reflects flow regime: a steep slope indicates highly variable flow (flashy streams, small snow-dominated basins); a shallow slope indicates stable flow (large regulated rivers, groundwater-fed streams).
3.2 Return Period and Exceedance Probability
The return period $T$ [years] of an extreme event is the average recurrence interval — the expected number of years between events of that magnitude or worse:
\[T = \frac{1}{P_{\text{exceed}}}\]A 100-year event has $P_{\text{exceed}} = 0.01$ — a 1% chance of being exceeded in any given year. This is a probability statement about annual maxima (for floods) or annual minima (for droughts), not a prediction about timing.
The probability that at least one 100-year event occurs in a $n$-year design life:
\[P(\text{at least one exceedance in } n \text{ years}) = 1 - (1 - 1/T)^n\]For $T = 100$ years and $n = 50$ year design life:
\[P = 1 - (1 - 0.01)^{50} = 1 - 0.99^{50} = 1 - 0.605 = 0.395\]There is a 39.5% chance that a 100-year drought occurs at least once in a 50-year design life — a substantial risk that purely deterministic design (sizing to the observed worst drought) does not capture.
Extreme value distributions: Annual maximum flows are often modelled by the Gumbel (EV1) distribution; annual minimum flows by the log-Pearson Type III (LP3) or log-normal. For the log-normal distribution of annual streamflow $Q$:
\[\ln Q \sim \mathcal{N}(\mu_{\ln Q},\, \sigma_{\ln Q}^2)\]The $T$-year minimum flow:
\[Q_T = \exp(\mu_{\ln Q} - z_{1/T} \cdot \sigma_{\ln Q})\]where $z_{1/T} = \Phi^{-1}(1/T)$ is the standard normal quantile at exceedance probability $1/T$.
3.3 The Thomas-Fiering Autoregressive Model
The Thomas-Fiering model (1962) generates monthly synthetic streamflow by preserving the historical mean, standard deviation, and lag-1 autocorrelation for each calendar month:
\[Q_{t+1}^{(m+1)} = \bar{Q}^{(m+1)} + b_m \left(Q_t^{(m)} - \bar{Q}^{(m)}\right) + \varepsilon_t \sigma^{(m+1)}\sqrt{1 - r_m^2}\]where:
- $Q_t^{(m)}$ = streamflow in month $m$ of year $t$
- $\bar{Q}^{(m)}$ = mean flow in calendar month $m$ over historical record
- $\sigma^{(m)}$ = standard deviation of flow in calendar month $m$
- $r_m$ = lag-1 cross-correlation between month $m$ and month $m+1$ in the historical record
- $b_m = r_m \sigma^{(m+1)} / \sigma^{(m)}$ = regression coefficient
- $\varepsilon_t \sim \mathcal{N}(0,1)$ = standard normal random deviate
The term $b_m(Q_t^{(m)} - \bar{Q}^{(m)})$ propagates the departure from the mean forward to the next month — modelling persistence. The $\varepsilon$ term adds random variability. The factor $\sqrt{1-r_m^2}$ scales the random noise so that the generated series has the correct variance.
Log-transformation: Because streamflow is non-negative and often right-skewed, the Thomas-Fiering model is typically applied to $\ln Q$ values rather than $Q$ directly, then exponentiated. This preserves positivity and reduces skewness.
Generating long records: Running the Thomas-Fiering model for 10,000 years of synthetic monthly flows produces a record 100× longer than a typical instrumental record, providing:
- Better estimation of rare drought probabilities
- More robust sequent peak analysis (Essay AR1)
- Quantification of the full distribution of water supply reliability
3.4 Drought Indices
Standardised Precipitation Index (SPI) measures precipitation anomaly relative to the long-term distribution. For a given accumulation period $k$ (1, 3, 6, 12, 24 months):
- Fit a gamma distribution to the historical precipitation totals over $k$ months
- Transform to cumulative probability: $P = F_{\gamma}(x; \hat{\alpha}, \hat{\beta})$
- Transform to standard normal: $\text{SPI}_k = \Phi^{-1}(P)$
SPI interpretation:
| SPI value | Category |
|---|---|
| ≥ 2.0 | Extremely wet |
| 1.0–1.99 | Moderately wet |
| −0.99 to 0.99 | Near normal |
| −1.0 to −1.49 | Moderately dry |
| −1.5 to −1.99 | Severely dry |
| ≤ −2.0 | Extremely dry |
SPI-12 (12-month accumulation) is the standard metric for hydrological drought; SPI-3 captures agricultural drought; SPI-1 reflects meteorological drought.
Palmer Drought Severity Index (PDSI) extends the drought index to incorporate both precipitation and temperature effects on soil moisture via a simplified water balance model. It has longer memory than SPI and better captures agricultural drought impacts but is more complex to compute and calibrated for specific climate regions (the original calibration was for the US Great Plains; Alberta calibration uses regional parameters).
The PDSI formula:
\[X_t = 0.897 X_{t-1} + \frac{Z_t}{3}\]where $Z_t$ is the monthly moisture anomaly index $Z_t = K_t(d_t)$, with $d_t$ the moisture departure (actual minus climatologically appropriate moisture) and $K_t$ a regional scaling factor. The 0.897 autoregressive coefficient gives PDSI its characteristic memory — a drought that began months ago continues to influence the current index even after precipitation has returned.
3.5 Reliability-Resilience-Vulnerability Framework
The RRV framework (Hashimoto et al. 1982) provides three complementary metrics for evaluating water supply system performance:
Reliability $\alpha$ — fraction of time steps with no failure:
\[\alpha = 1 - \frac{\text{number of failure time steps}}{\text{total time steps}}\]Resilience $\gamma$ — probability of recovering from a failure in the next time step (how quickly the system bounces back):
\[\gamma = \frac{\text{number of transitions from failure to success}}{\text{number of failure time steps}}\]Vulnerability $v$ — average severity of failures when they occur:
\[v = \frac{\sum_{\text{failure}} (\text{Demand} - \text{Supply})_t}{\text{number of failure time steps}}\]A system with high reliability but low resilience recovers slowly once a drought begins — possibly experiencing an extended severe shortage. A system with moderate reliability but high resilience experiences frequent but brief shortfalls. The relative importance of these metrics depends on context: urban water supply prioritises reliability; irrigation with crop flexibility may tolerate lower reliability with high resilience.
Deficit ratio: total cumulative deficit as a fraction of total demand, also called vulnerability index:
\[VI = \frac{\sum_t \max(0, D - S_t)}{\sum_t D}\]4. Worked Example by Hand
Setting: Monthly SPI calculation for Edmonton, December 2021. The 12-month precipitation total ending December 2021 was 340 mm; historical 12-month December totals have mean 415 mm and standard deviation 68 mm (approximately normal).
Step 1: Standardise the precipitation anomaly. For approximately normal $P$ totals:
\[\text{SPI}_{12} \approx \frac{x - \mu}{\sigma} = \frac{340 - 415}{68} = \frac{-75}{68} = -1.10\]Interpretation: SPI-12 = −1.10 → Moderately dry. The 12-month precipitation ending December 2021 was 1.10 standard deviations below the historical mean — consistent with the moderate drought conditions observed across central Alberta in 2021.
Return period of this SPI level: $P(\text{SPI} \leq -1.10) = \Phi(-1.10) = 0.136$. A year with SPI-12 ≤ −1.10 occurs in 13.6% of years → return period $T = 1/0.136 = 7.4$ years. Moderately dry conditions of this severity or worse occur roughly every 7–8 years in the Edmonton climate record.
Thomas-Fiering one-step generation:
Historical parameters for January: $\bar{Q}{\text{Jan}} = 9.5$ Mm³/mo, $\sigma{\text{Jan}} = 2.1$ Mm³/mo, $r_{\text{Dec-Jan}} = 0.68$.
If December flow was $Q_{\text{Dec}} = 7.2$ Mm³ ($\bar{Q}{\text{Dec}} = 8.8$, $\sigma{\text{Dec}} = 1.9$), and $\varepsilon = -0.4$:
\[b_{\text{Dec}} = 0.68 \times \frac{2.1}{1.9} = 0.752\]\(Q_{\text{Jan}} = 9.5 + 0.752(7.2 - 8.8) + (-0.4)(2.1)\sqrt{1 - 0.68^2}\) \(= 9.5 + 0.752(-1.6) + (-0.4)(2.1)(0.733)\) \(= 9.5 - 1.203 - 0.615 = 7.68 \text{ Mm}^3/\text{mo}\)
The below-average December flow (7.2 vs. mean 8.8) propagates as a below-average January (7.68 vs. mean 9.5), consistent with drought persistence.
5. Computational Implementation
function flow_duration_curve(Q_array):
    Q_sorted = sort_descending(Q_array)
    n = len(Q_sorted)
    exceedance = [(i+1)/(n+1) for i in range(n)]
    return Q_sorted, exceedance

function return_period_lognormal(Q_array, T):
    mu = mean(log(Q_array))
    sigma = std(log(Q_array))
    z = inverse_normal_cdf(1/T)     # left tail (drought)
    return exp(mu + z * sigma)

function thomas_fiering(n_years, monthly_stats, seed=42):
    # monthly_stats: list of (mean, std, lag1_corr) for 12 months
    Q = zeros(n_years * 12)
    Q[0] = monthly_stats[0].mean
    for t in range(1, n_years * 12):
        m_prev = (t-1) % 12; m_curr = t % 12
        mu_prev, sigma_prev, _ = monthly_stats[m_prev]
        mu_curr, sigma_curr, r = monthly_stats[m_prev]  # r is Dec→Jan corr
        b = r * sigma_curr / sigma_prev
        eps = normal_random()
        Q[t] = mu_curr + b*(Q[t-1] - mu_prev) + eps * sigma_curr * sqrt(1 - r**2)
        Q[t] = max(0, Q[t])
    return Q

function spi(precip_series, k_months):
    totals = rolling_sum(precip_series, k_months)
    mu, sigma = mean(totals), std(totals)
    return (totals - mu) / sigma   # approximate (normal assumption)
import numpy as np
from scipy import stats

rng = np.random.default_rng(42)

def flow_duration_curve(Q):
    Qs = np.sort(Q)[::-1]
    n = len(Qs)
    p = np.arange(1, n+1) / (n+1)
    return Qs, p

def return_period_lognormal(Q, T):
    mu = np.mean(np.log(Q))
    sigma = np.std(np.log(Q), ddof=1)
    z = stats.norm.ppf(1.0/T)   # lower tail for drought
    return np.exp(mu + z * sigma)

def thomas_fiering(n_years, means, stds, corrs):
    """Monthly Thomas-Fiering model."""
    Q = []
    q = means[0]
    for yr in range(n_years):
        for m in range(12):
            m_next = (m + 1) % 12
            b = corrs[m] * stds[m_next] / stds[m]
            eps = rng.standard_normal()
            q_next = (means[m_next] + b*(q - means[m])
                      + eps * stds[m_next] * np.sqrt(1 - corrs[m]**2))
            Q.append(max(0.01, q_next))
            q = q_next
    return np.array(Q)

# Generate 200 years of monthly flows
means = np.array([8,7,9,18,35,45,28,12,9,6,5,4], dtype=float)
stds  = np.array([2,1.8,2,4,7,8,6,3,2,1.5,1.3,1.2])
corrs = np.array([0.7,0.7,0.65,0.6,0.55,0.5,0.55,0.6,0.65,0.7,0.72,0.72])

Q_syn = thomas_fiering(200, means, stds, corrs)
annual = Q_syn.reshape(-1, 12).sum(axis=1)
print(f"Generated {len(Q_syn)//12} years of monthly flow")
print(f"Annual mean: {annual.mean():.1f} Mm³/yr  (historical: {means.sum():.0f})")
print(f"Annual std:  {annual.std():.1f} Mm³/yr")

# Return period of low flows
for T in [10, 50, 100, 200]:
    Q_T = return_period_lognormal(annual, T)
    print(f"  {T:3d}-yr minimum annual flow: {Q_T:.1f} Mm³")

# SPI example
precip_monthly = rng.normal(35, 12, 120)  # 10 years synthetic
spi_12 = []
for i in range(11, len(precip_monthly)):
    total = precip_monthly[i-11:i+1].sum()
    spi_12.append(total)
spi_12 = np.array(spi_12)
spi_12 = (spi_12 - spi_12.mean()) / spi_12.std()
n_drought = (spi_12 <= -1.5).sum()
print(f"\nSPI-12 severe drought months: {n_drought}/{len(spi_12)} ({100*n_drought/len(spi_12):.1f}%)")
6. Visualization
The FDC spans two orders of magnitude from the highest 1% flows (92 Mm³/mo, spring snowmelt) to the lowest 1% flows (2.5 Mm³/mo, January baseflow). The steep slope reflects the highly seasonal flow regime of a Rocky Mountain tributary. Environmental flow standards typically protect the $Q_{90}$–$Q_{95}$ range (5–7 Mm³/mo) as minimum ecologically required flows.
7. Interpretation
The return period framework transforms drought risk from a qualitative concern into a quantitative design criterion. A water authority that accepts a 10% probability of shortage in any given year is implicitly designing to a 10-year return period drought. If the design life is 50 years, this implies a 99.5% probability of at least one shortage in 50 years — a very different statement than “10% annual risk” suggests.
The Thomas-Fiering model’s key property is preservation of persistence through the lag-1 autocorrelation. Streamflow exhibits persistence: wet years tend to follow wet years because soil moisture, snowpack, and groundwater carry hydrological memory from month to month. A model without persistence (i.e., drawing each month’s flow independently from its historical distribution) underestimates multi-year drought risk because it cannot reproduce the clustering of below-average years that constitutes a genuine prolonged drought. The autoregressive structure directly addresses this — and the 10,000-year synthetic records it produces reveal drought events of severity and duration that never appear in the 80-year instrumental record.
8. What Could Go Wrong?
Log-normality is an approximation. Many streamflow series exhibit heavier tails than the log-normal — particularly in flashy semi-arid catchments. Using a log-normal fit underestimates the probability of extreme low flows. Fitting the LP3 (log-Pearson Type III) distribution, which has an additional skewness parameter, provides better tail representation. For planning in data-limited regions, the choice of distribution can change the estimated 100-year drought flow by 20–40%.
Thomas-Fiering preserves only lag-1 autocorrelation. Multi-year droughts like the 1930s Dust Bowl involve correlations at lag 2, 3, and beyond — El Niño teleconnections, Pacific Decadal Oscillation (PDO), and Atlantic Multidecadal Oscillation (AMO) drive correlated anomalies over years to decades. The first-order autoregressive model generates multi-year droughts less severe than observed paleoclimate records suggest is possible. Higher-order AR models or ARIMA models capture more of this persistence.
SPI assumes stationarity. The SPI is calibrated to the historical precipitation distribution, which is assumed to represent future conditions. Under climate change, both the mean and variance of precipitation are shifting — the historical calibration period no longer represents the climatological baseline. Non-stationary SPI calculations using rolling calibration windows are an active research area.
The RRV framework treats all shortfalls equally. A 1% deficit in delivery and a 50% deficit both count as one “failure time step” in the reliability count, and vulnerability averages their severities. In practice, a 50% water shortage is not merely 50× worse than 1% — it triggers rationing, social conflict, and economic disruption that grow nonlinearly with deficit magnitude. Weighted vulnerability metrics and economic damage functions provide more realistic risk characterisation.
9. Summary
The flow duration curve characterises the full distribution of streamflow magnitudes. Return period $T = 1/P$ converts exceedance probability to recurrence interval; a 100-year event has a 39.5% chance of occurring at least once in a 50-year design life. The Thomas-Fiering model generates synthetic monthly flows preserving mean, variance, and lag-1 autocorrelation, enabling probabilistic risk assessment from arbitrarily long synthetic records.
Drought indices — SPI (precipitation anomaly) and PDSI (water balance anomaly) — quantify drought severity on standardised scales. The RRV framework measures system performance as reliability (fraction of time without failure), resilience (recovery speed), and vulnerability (average deficit magnitude). Together these metrics provide a complete characterisation of water supply risk.
Key equations:
\[P_{\text{exceed}}(i) = i/(n+1) \quad\text{[Weibull plotting position]}\] \[T = 1/P_{\text{exceed}}, \quad P(\ge 1 \text{ event in } n \text{ yr}) = 1-(1-1/T)^n\] \[Q_{t+1}^{(m+1)} = \bar{Q}^{(m+1)} + b_m(Q_t^{(m)}-\bar{Q}^{(m)}) + \varepsilon\sigma^{(m+1)}\sqrt{1-r_m^2}\] \[\text{SPI}_k = \Phi^{-1}(F_\gamma(x;\hat\alpha,\hat\beta))\]Math Refresher
The normal distribution and standardisation. Subtracting the mean and dividing by the standard deviation — $z = (x-\mu)/\sigma$ — transforms any normal distribution to the standard normal $\mathcal{N}(0,1)$. The resulting $z$-score measures how many standard deviations the observation is from the mean. SPI exploits this: by first transforming precipitation to a normal distribution and then standardising, it produces a score that is directly interpretable and comparable across climates and accumulation periods. SPI = −1.5 means “1.5 standard deviations below the mean” — a meaningful statement regardless of whether the local precipitation mean is 300 mm or 1200 mm per year.
Autoregressive models as memory. The AR(1) model $Q_t = \phi Q_{t-1} + \varepsilon_t$ says: this month’s flow equals last month’s flow times a persistence coefficient $\phi$, plus random noise. If $\phi = 0$, months are independent. If $\phi = 0.7$, 70% of the current anomaly is inherited from the previous month. Applying this monthly: after $k$ months without forcing, the anomaly decays by factor $\phi^k$. For $\phi = 0.7$, a drought anomaly decays to 7% of its initial size after $k = \log(0.07)/\log(0.7) \approx 8$ months — roughly one season of persistence, consistent with observed streamflow memory in snow-dominated basins.