Soil Carbon Storage and Decomposition
Soils hold more carbon than the atmosphere and all living vegetation combined — approximately 1,500–2,400 billion tonnes. Most of this carbon is in slow-cycling pools with residence times of decades to centuries, but even small changes in decomposition rates driven by warming can release enormous carbon pulses. This essay derives the steady-state soil carbon model from first principles, defines and applies the Q₁₀ temperature sensitivity, models moisture effects on decomposition, and evaluates the potential for agricultural carbon sequestration.
Prerequisites: first order decay (residence time model), steady state solution dC/dt = 0, Q₁₀ temperature sensitivity, moisture response functions
Under the boreal forests and peatlands of northern Canada lies one of the largest carbon reservoirs on Earth. Canadian peatlands alone hold an estimated 150 billion tonnes of carbon — comparable to 15 years of global fossil fuel emissions — accumulated over the past 10,000 years at rates of 15–30 g C m⁻² yr⁻¹. This accumulation rate is tiny: it requires centuries of slow peat formation to compensate for a single bad fire year. The security of this reservoir depends on the balance between organic matter inputs from plant litter and outputs from microbial decomposition. Change either side of this balance — through warming, drainage, or land use change — and the reservoir becomes a source.
1. The Question
What determines how much carbon a soil holds at steady state? How sensitive is decomposition to temperature, and what does this imply for climate feedbacks? How does moisture control microbial activity, and what is the mitigation potential of agricultural carbon sequestration?
2. The Conceptual Model
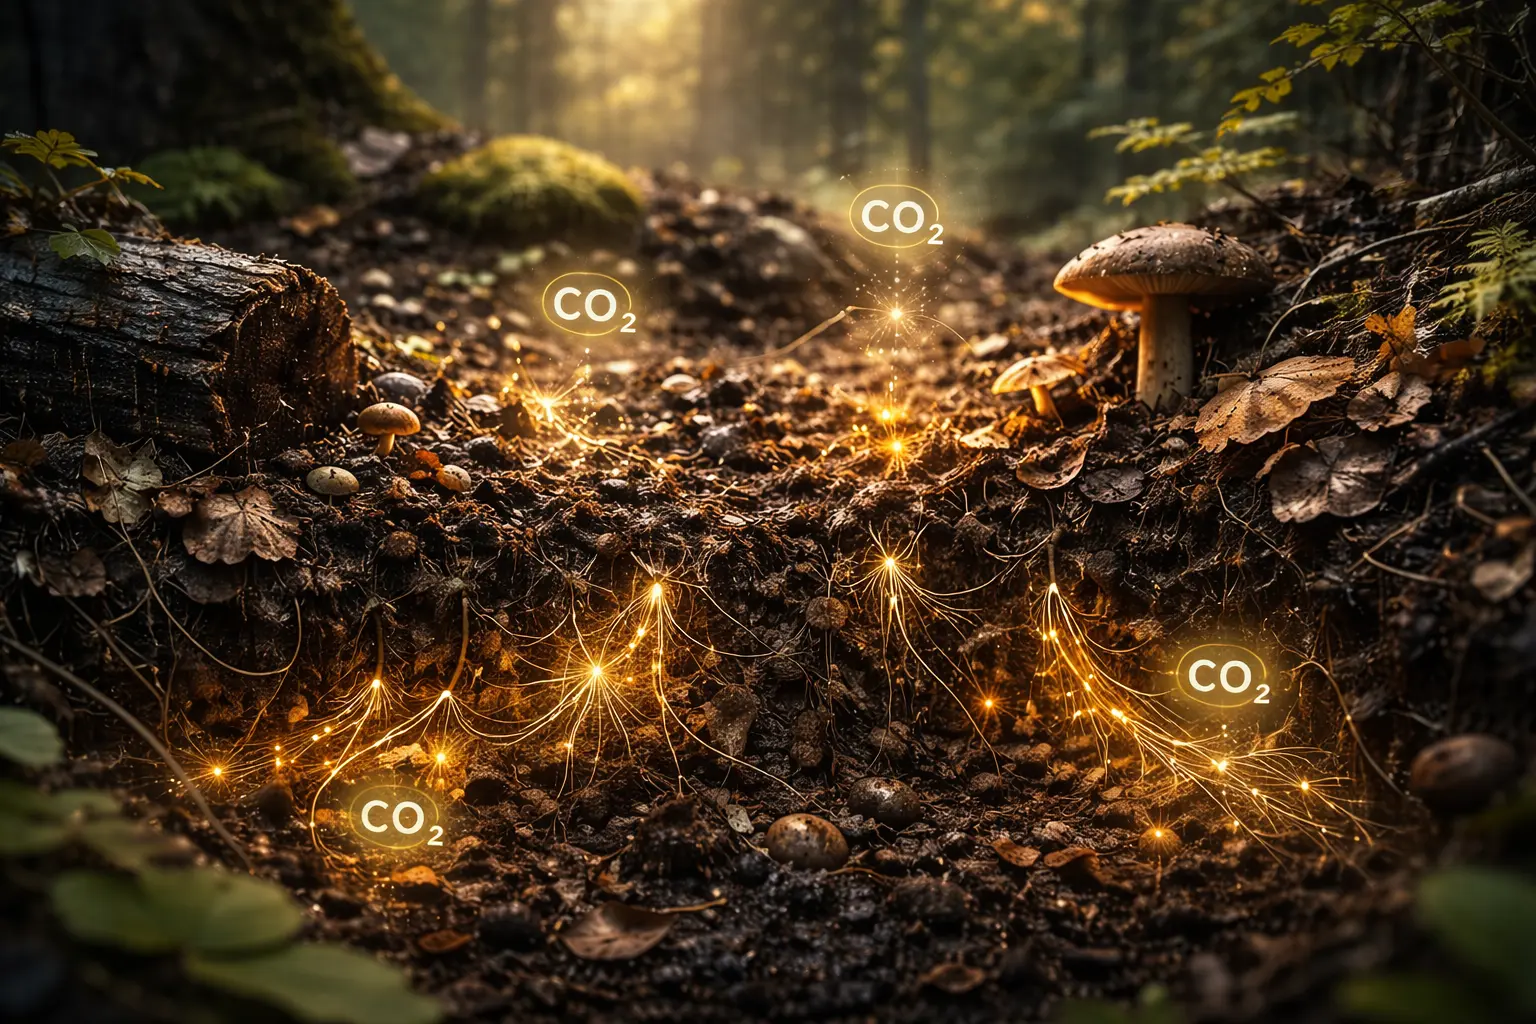
Soil carbon dynamics are governed by a mass balance: inputs from plant litter and roots, minus outputs from microbial decomposition (heterotrophic respiration). At steady state, inputs equal outputs and soil carbon remains constant. Warming accelerates decomposition (potentially outpacing any increase in plant inputs), shifting soils from carbon sinks to sources. Waterlogging inhibits decomposition (peat formation); drainage accelerates it (peat loss).
3. Building the Mathematical Model
3.1 The Single-Pool First-Order Decay Model
The simplest soil carbon model treats the entire soil organic carbon pool $C$ (kg C m⁻²) as a single pool with constant input rate $I$ (kg C m⁻² yr⁻¹) and first-order decomposition rate $k$ (yr⁻¹):
\[\frac{dC}{dt} = I - k \times C\]Steady-state solution ($dC/dt = 0$):
\[C^* = \frac{I}{k}\]The equilibrium soil carbon stock is the ratio of input to decomposition rate. Mean residence time (MRT):
\[\tau = \frac{1}{k} = \frac{C^*}{I}\]Transient response: Starting from initial stock $C_0$:
\[C(t) = C^* + (C_0 - C^*)e^{-kt}\]The system approaches the new equilibrium exponentially with time constant $\tau = 1/k$. A soil with $k = 0.01$ yr⁻¹ has MRT = 100 years — it takes ~500 years (5 time constants) to fully equilibrate after a change in inputs or temperature.
Example: Canadian boreal forest mineral soil. Input $I = 100$ g C m⁻² yr⁻¹ (litterfall + fine root turnover). Measured SOC = 8,000 g C m⁻² (8 kg C m⁻²). Implied $k = I/C^* = 100/8000 = 0.0125$ yr⁻¹, MRT = 80 years.
3.2 Multi-Pool Model
Real soils have carbon in multiple pools with different turnover rates. The IPCC Roth-C model (Jenkinson 1990, Coleman & Jenkinson 1996) partitions SOC into:
| Pool | $k$ (yr⁻¹) | MRT (yr) | % of SOC |
|---|---|---|---|
| Decomposable plant material (DPM) | 10 | 0.1 | 0.1% |
| Resistant plant material (RPM) | 0.3 | 3 | 2% |
| Microbial biomass (BIO) | 0.66 | 1.5 | 3% |
| Humified organic matter (HUM) | 0.02 | 50 | 65% |
| Inert organic matter (IOM) | 0 | ∞ | 30% |
Each pool has its own differential equation:
\[\frac{dC_i}{dt} = I_i - k_i C_i + \text{transfers from other pools}\]The multi-pool structure captures the observed biphasic response of soil carbon: fast early losses from labile pools (years to decades) followed by slow, centuries-scale losses from stable pools.
3.3 Temperature Sensitivity: Q₁₀
The Q₁₀ factor describes how decomposition rate changes with a 10°C temperature increase:
\[Q_{10} = \frac{k(T + 10)}{k(T)}\]This can be derived from the Arrhenius equation:
\[k(T) = A \times e^{-E_a / RT}\]where $E_a$ is the activation energy and $R = 8.314$ J mol⁻¹ K⁻¹. The Q₁₀ relationship:
\[Q_{10} = e^{10 E_a / RT^2}\]For typical soil organic matter, $E_a \approx 50\text{–}70$ kJ mol⁻¹, giving $Q_{10} \approx 2.0\text{–}3.0$ at 10°C. This means a 10°C warming doubles to triples the decomposition rate.
Temperature scalar $f(T)$ in soil carbon models (commonly a $Q_{10}$ formulation):
\[f(T) = Q_{10}^{(T - T_{\text{ref}})/10}\]where $T_{\text{ref}}$ = reference temperature (usually 10°C). At 20°C: $f(20) = Q_{10}^{10/10} = Q_{10}$ (double the reference rate for $Q_{10} = 2$).
Climate feedback implication: If current global SOC = 1,500 Gt C, $k = 0.015$ yr⁻¹ at 10°C mean soil temperature, and $Q_{10} = 2$:
Under 3°C warming: $k_{\text{new}} = 0.015 \times 2^{3/10} = 0.015 \times 1.231 = 0.0185$ yr⁻¹
New equilibrium SOC: $C^*{\text{new}} = I/k{\text{new}}$ — but if inputs $I$ also increase with warming (more plant growth), the net effect is smaller. The key uncertainty is whether photosynthesis increases faster or slower than decomposition under warming.
If the system is perturbed out of steady state: excess decomposition = $(k_{\text{new}} - k_{\text{old}}) \times C^* = 0.0035 \times 1500 = 5.25$ Gt C yr⁻¹ of additional respiration — comparable to total fossil fuel emissions — until the system reaches the new (lower) equilibrium. This is the theoretical maximum of the soil carbon-climate feedback, but the actual feedback is much smaller because: (1) inputs also increase; (2) the stable pool has lower apparent $Q_{10}$; (3) moisture constraints may counteract warming.
3.4 Moisture Effects on Decomposition
Soil moisture $\theta$ (m³ m⁻³) controls decomposition through:
- Solute diffusion: Below field capacity, decreasing moisture limits transport of substrates and products, reducing microbial activity
- Oxygen availability: Above field capacity, water fills pores and restricts O₂ diffusion, limiting aerobic decomposition. In anoxic conditions, anaerobic decomposition predominates (much slower for organic matter; leads to CH₄ production in wetlands — Essay AO1)
Moisture response function (Rodrigo et al. 1997):
\[f(W) = \begin{cases} 0 & \theta < \theta_{\text{wilt}} \\ \frac{\theta - \theta_{\text{wilt}}}{\theta_{\text{fc}} - \theta_{\text{wilt}}} & \theta_{\text{wilt}} < \theta < \theta_{\text{fc}} \\ 1 & \theta = \theta_{\text{fc}} \\ \left(\frac{\theta_{\text{sat}} - \theta}{\theta_{\text{sat}} - \theta_{\text{fc}}}\right)^{1.5} & \theta > \theta_{\text{fc}} \end{cases}\]where $\theta_{\text{wilt}}$ = wilting point, $\theta_{\text{fc}}$ = field capacity, $\theta_{\text{sat}}$ = saturation. Maximum decomposition occurs near field capacity; both drought and waterlogging suppress it.
Peat formation occurs when the annual mean moisture is so high that $f(W)$ stays low for most of the year, causing inputs to exceed decomposition year after year. Boreal peatlands have been accumulating carbon at this rate for ~10,000 years.
3.5 Agricultural Carbon Sequestration Potential
Under changed management, agricultural soils can shift from carbon sources to sinks. The change in steady-state carbon:
\[\Delta C^* = \frac{\Delta I}{k} + \frac{I \times (-\Delta k)}{k^2} = \frac{\Delta I}{k} - \frac{\Delta k \times C^*}{k}\]Sequestration mechanisms and potential:
| Practice | Annual rate (t CO₂ ha⁻¹ yr⁻¹) | Duration (yr) | Notes |
|---|---|---|---|
| Cover crops | 0.3–1.1 | 20–50 | Increases $I$; limited by N |
| Reduced tillage | 0.1–0.5 | 20–40 | Reduces disturbance of aggregates |
| No-till | 0.2–0.8 | 20–50 | Surface-layer enrichment |
| Organic amendments | 0.5–2.0 | 10–30 | Manure, compost additions |
| Biochar application | 0.5–3.2 | 50–1000 | Pyrogenic C; very long MRT |
| Grassland restoration | 0.5–2.0 | 30–80 | High root inputs |
Sequestration rates decline over time as soils approach the new (higher) equilibrium — the “saturation effect.” Alberta prairie soils have large historical carbon deficits from cultivation, suggesting substantial sequestration potential if management is improved.
4. Worked Example by Hand
Setting: Prairie cropland in southern Alberta converted from cultivated to no-till with cover crops. Initial SOC = 3,000 g C m⁻², input $I = 80$ g C m⁻² yr⁻¹, $k = 0.025$ yr⁻¹ (MRT = 40 yr). After conversion: input increases to $I’ = 110$ g C m⁻² yr⁻¹ ($+30$ g, from cover crop roots and residues), $k$ slightly decreases to $0.023$ yr⁻¹ (less disturbance).
Initial steady state: $C^*_0 = 80/0.025 = 3,200$ g m⁻² (currently at 3,000 — below equilibrium, already building toward 3,200).
New equilibrium: $C^*_{\text{new}} = 110/0.023 = 4,783$ g m⁻²
Additional carbon to sequester: $\Delta C^* = 4,783 - 3,200 = 1,583$ g m⁻² ≈ 15.8 t C ha⁻¹
Annual sequestration rate (early years, exponential approach):
Rate = $(C^*_{\text{new}} - C(0)) \times k’ = (4783 - 3000) \times 0.023 \approx 41$ g C m⁻² yr⁻¹ initially, declining over decades.
Equivalent to: $41 \times 44/12 / 100 \approx 1.5$ t CO₂ ha⁻¹ yr⁻¹ in first years.
5. Computational Implementation
function steady_state_SOC(I, k):
    return I / k  # g C m-2

function transient_SOC(C0, C_star, k, t_array):
    return C_star + (C0 - C_star) * exp(-k * t_array)

function decomp_rate_Q10(k_ref, T, T_ref=10, Q10=2.0):
    return k_ref * Q10**((T - T_ref) / 10)

function moisture_scalar(theta, theta_wilt, theta_fc, theta_sat):
    if theta < theta_wilt: return 0
    if theta <= theta_fc: return (theta - theta_wilt) / (theta_fc - theta_wilt)
    return ((theta_sat - theta) / (theta_sat - theta_fc))**1.5

function carbon_sequestration_timeseries(C0, C_new_eq, k_new, n_years):
    t = arange(n_years)
    C_t = transient_SOC(C0, C_new_eq, k_new, t)
    annual_seq = diff(C_t)  # g C m-2 yr-1
    return t[1:], annual_seq
import numpy as np

def transient_SOC(C0, C_star, k, t):
    return C_star + (C0 - C_star) * np.exp(-k * t)

def Q10_rate(k_ref, T, T_ref=10, Q10=2.0):
    return k_ref * Q10**((T - T_ref)/10)

# Alberta prairie scenario
print("Multi-scenario soil carbon evolution (50 years):")
print(f"{'Scenario':>30} {'ΔC (t C/ha)':>13} {'Rate yr 5':>12} {'Rate yr 20':>12}")
print("-"*70)

scenarios = [
    ('Current (business as usual)', 3000, 3200, 0.025, 80),
    ('Cover crops + no-till',       3000, 4783, 0.023, 110),
    ('Biochar addition (50 t/ha)',  3000, 5200, 0.020, 110),
    ('Grassland restoration',       3000, 6500, 0.015, 130),
]

t = np.arange(0, 51)
for name, C0, Cstar, k, I in scenarios:
    C = transient_SOC(C0, Cstar, k, t)
    dC_total = (C[50] - C[0]) / 100   # t C/ha
    rate_y5  = (C[5] - C[4]) / 100
    rate_y20 = (C[20] - C[19]) / 100
    print(f"{name:>30} {dC_total:>13.1f} {rate_y5:>12.3f} {rate_y20:>12.3f}")

# Q10 temperature sensitivity
print(f"\nQ₁₀ effect: decomposition rate vs temperature (k_ref=0.025 at 10°C)")
print(f"{'T (°C)':>8} {'Q10=1.5':>10} {'Q10=2.0':>10} {'Q10=2.5':>10} {'C* (Q10=2)':>12}")
I = 80  # g C/m2/yr
for T in [0, 5, 10, 15, 20, 25]:
    k15 = Q10_rate(0.025, T, Q10=1.5)
    k20 = Q10_rate(0.025, T, Q10=2.0)
    k25 = Q10_rate(0.025, T, Q10=2.5)
    Cstar = I / k20
    print(f"{T:>8}  {k15:>10.4f} {k20:>10.4f} {k25:>10.4f} {Cstar:>10.0f} g/m²")
6. Visualization
Sequestration rates are highest in the early years (large disequilibrium), declining as the system approaches the new equilibrium. After 50 years, cover crops + no-till have added ~15 t C ha⁻¹; grassland restoration adds ~28 t C ha⁻¹. Neither reaches the new equilibrium within 50 years — maximum sequestration potential requires centuries of consistent management.
7. Interpretation
The steady-state result $C^* = I/k$ has a profound implication for climate feedback: if warming increases $k$ faster than it increases $I$ (net primary production), then $C^*$ decreases — soils release carbon to the atmosphere even as plants continue producing litter at the same rate. The question of whether NPP increases faster than decomposition under warming is the central uncertainty in the soil carbon-climate feedback, and it varies by ecosystem: in the tropics (already warm), decomposition is near its temperature optimum while NPP may be water-limited; in the Arctic (cold), warming strongly accelerates decomposition while plant growth may be less responsive.
The agricultural sequestration numbers are real but bounded. Alberta’s cultivated soils have lost 30–50% of their pre-cultivation SOC; restoring even 20% of this deficit across 20 million ha of cultivated land would sequester 60–100 Mt CO₂ — meaningful at the provincial scale but small compared to Alberta’s ~275 Mt CO₂ yr⁻¹ emissions. Soil carbon sequestration is an important mitigation strategy but cannot substitute for emissions reductions.
8. What Could Go Wrong?
Priming effects. Adding fresh, labile organic matter (manure, crop residues) to soil can accelerate the decomposition of older, stable SOC — the “priming effect.” This means that increasing inputs $I$ does not always increase SOC linearly; if the new inputs prime decomposition of existing SOC, the net sequestration is less than the single-pool model predicts. Priming effects can be positive (accelerated decomposition) or negative (old SOC protected), and their magnitude depends on substrate quality and microbial community composition.
Soil depth and vertical distribution. Most soil carbon measurements and models focus on the top 30 cm, but substantial carbon exists at 30–100 cm and deeper. Tillage homogenises the top 30 cm but does not change the deep layer; no-till enriches the surface but leaves deep layers unchanged. Deep soil carbon has longer MRT (often >1000 years) but may be vulnerable to disturbance in ways that shallow measurements miss.
Spatial heterogeneity in Q₁₀. The Q₁₀ of the labile pool (~2.5–3.0) exceeds the Q₁₀ of the stable pool (~1.0–1.5), because recalcitrant compounds have higher activation energies. A spatially aggregated Q₁₀ of 2.0 applied to the total SOC pool overestimates warming-driven losses from stable pools (which dominate total SOC) and underestimates losses from labile pools (which are more responsive). Multi-pool models with pool-specific Q₁₀ values are necessary for accurate projections.
9. Summary
The steady-state soil carbon model: $C^* = I/k$, where $I$ = organic carbon input rate and $k$ = first-order decomposition rate. Residence time $\tau = 1/k$. Transient response: $C(t) = C^* + (C_0 - C^*)e^{-kt}$.
Temperature sensitivity: $k(T) = k_{\text{ref}} \times Q_{10}^{(T-T_{\text{ref}})/10}$ with $Q_{10} \approx 2.0$–2.5. A 3°C warming increases $k$ by ~23–48%, reducing $C^*$ and driving net carbon release until a new (lower) equilibrium is reached. Moisture response is non-monotonic: maximum decomposition near field capacity; suppressed by drought and waterlogging.
Agricultural carbon sequestration: no-till + cover crops can sequester 0.2–1.5 t CO₂ ha⁻¹ yr⁻¹ for decades, approaching a new higher equilibrium. Rates decline as soils saturate.
Key equations:
\[\frac{dC}{dt} = I - kC, \quad C^* = \frac{I}{k}, \quad \tau = \frac{1}{k}\] \[k(T) = k_{\text{ref}} \times Q_{10}^{(T-T_{\text{ref}})/10}\] \[\Delta C^*_{\text{warming}} = -C^* \times \frac{\Delta k}{k} \approx -C^* \times (Q_{10}^{\Delta T/10} - 1)\]Math Refresher
Steady-state solutions of first-order ODEs. The equation $dC/dt = I - kC$ is a first-order linear ODE. At steady state, $dC/dt = 0$, giving $C^* = I/k$ — the carbon stock where input exactly balances output. Starting from $C_0 \neq C^$, the solution is $C(t) = C^ + (C_0 - C^)e^{-kt}$, approaching $C^$ exponentially. The time constant $\tau = 1/k$ characterises the approach speed: after one time constant, the gap $(C - C^*)$ has shrunk by factor $e^{-1} \approx 63\%$. After five time constants, the system is within 1% of equilibrium. This is the same mathematics as radioactive decay (Essay A3) with the crucial difference that $I > 0$ gives a non-zero steady state — the SOC accumulates until decomposition equals input, not until it disappears.