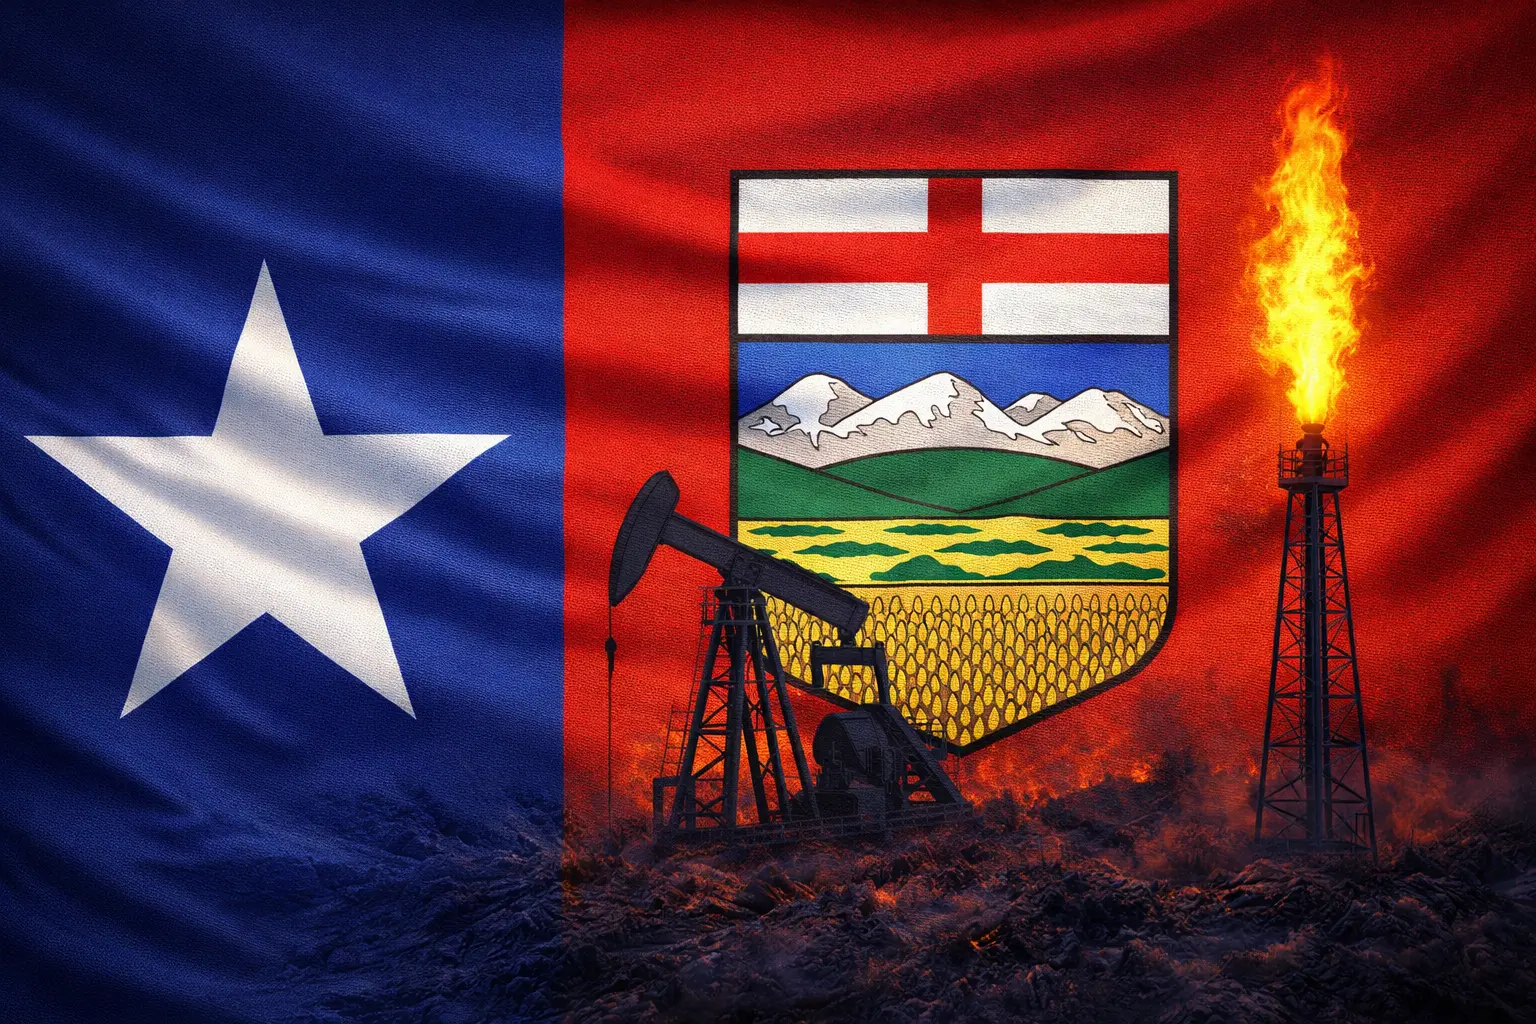
The Texas of the North
Alberta is routinely called the Texas of the North. The comparison is not without merit — both are energy economies that chafe against federal government. But the fiscal flows run opposite to what most Albertans assume, the pipeline jurisdiction problem does not disappear under American federalism, and Oklahoma may be the more instructive comparison than Texas.
Prerequisites: proportional reasoning
Part A: Why the Comparison Is Made at All
The Structural Parallel
Alberta is routinely called the Texas of the North, and the comparison is not without merit. Both are landlocked energy provinces whose political culture was shaped by the oil industry, both chafe against what they see as an unsympathetic federal government dominated by more populous coastal regions, and both generate more economic output than their population share would suggest. At the level of attitude and identity, the comparison resonates.
At the level of economic structure, it holds up reasonably well — and understanding exactly where it holds and where it breaks down is the point of this essay.
1.1 The Numbers Side by Side
| Indicator | Alberta | Texas | Oklahoma |
|---|---|---|---|
| Population | 4.9M | 31.3M | 4.1M |
| GDP (2024) | C$345B (~US$250B) | US$2.77T | US$273B |
| GDP per capita | ~C$70,000 | ~US$86,000 | ~US$65,000 |
| Share of national GDP | ~12.2% | ~9.4% of U.S. GDP | ~1% of U.S. GDP |
| Energy as % of exports/GDP | 72.5% of int’l exports | ~17.6% of GDP (goods) | Oil & gas ~23% of GDP |
| Unemployment rate (2024) | ~6.5% | ~4.1% | ~3.4% |
| No provincial/state income tax? | No — has provincial income tax | Yes — no state income tax | No — has state income tax |
| Federal transfers: net contributor? | Yes — massively (+$17B/yr) | No — net receiver ($71.1B in 2022) | Net receiver |
Sources: BEA, Statistics Canada, Dallas Fed, OERB, Rockefeller Institute 2022 data.1
The first surprise: Alberta is a net contributor to Canadian federal finances ($17B+ per year). Texas is a net receiver of federal funds, taking in $71.1 billion more from Washington than it pays in federal taxes. Alberta’s political identity includes the conviction that it funds everyone else. In the U.S. federal system, Texas is the one being funded.
1.2 What Makes the Parallel Work
Several structural features genuinely parallel between Alberta and Texas:
Resource concentration as identity. Both economies were built on extraction and shaped by the boom-bust cycle. The oil patch is not just an industry in either place — it is the foundational economic and cultural experience.
Resentment of federal overreach. Texas fought federal pipeline regulation, environmental restrictions, and land use policy for decades, just as Alberta has fought against the National Energy Program, carbon taxes, and federal pipeline authority.
Low-tax fiscal conservatism. Alberta has no provincial sales tax and Canada’s lowest provincial income taxes. Texas has no state income tax. Both political cultures treat low taxation as a core value.
Outsize economic contribution. Alberta generates 32.2% of Canadian exports from 12% of the population. Texas led all U.S. states in export revenues ($455B in 2024).
1.3 Oklahoma: A Complementary Comparison
Texas dominates the comparison because of its size and confidence. But Oklahoma is a useful additional comparison for Alberta — a smaller energy-dominated economy with structural over-dependence on oil and gas and a chronic tendency to underperform during busts.2
| Measure | Oklahoma | Alberta (analogous) |
|---|---|---|
| Oil & gas as % of state GDP (2024) | ~23% per OERB | ~72.5% of international exports |
| GDP per capita rank | 42nd of 50 states | Highest of Canadian provinces |
| Median household income vs. national | $62,000 vs. $78,000 (21% below) | Well above national average |
| GDP growth volatility | 6.6% boom, -2.1% bust (2011–2019) | Similar energy price correlation |
| Federal dependency | Net receiver | Net contributor |
| Poverty rate | 15.3% (above national 12.4%) | Below national average |
Sources: U.S. Census, BEA, Kansas City Fed, OERB, Statistics Canada.
Oklahoma’s economic history illustrates what happens when an energy-dependent economy faces sustained price pressure without diversification. During the 2011–2015 boom, Oklahoma averaged 4.3% annual GDP growth. During the bust (2015–2019), that collapsed to 0.5% — while the U.S. economy grew at 2% throughout.
Alberta’s per capita advantage over Oklahoma is enormous. But Oklahoma illustrates a trajectory risk: an energy economy that fails to diversify will deliver boom-and-bust cycles that leave the average citizen worse off than the national average, regardless of how much oil is in the ground.
Part B: What American-Style Federalism Actually Means for Energy
2.1 The Federal Fiscal Reality
The single most important fact in the Alberta-Texas comparison is the one least discussed: Texas is a net receiver of federal spending, not a net contributor.3
Alberta contributed a net $17 billion or more annually to Ottawa — a position maintained for decades. From 2007 to 2023, the cumulative net transfer was $267.4 billion.4
| Fiscal Measure | Alberta in Canada | Texas in USA |
|---|---|---|
| Annual net fiscal position | +$17B (contributor) | -$71.1B (recipient) |
| Federal tax paid vs. spending received | Pays far more than receives | Receives far more than pays |
| Equalization payments received | Zero — not since 1964 | Equivalent programs: net positive |
| Net contribution 2007–2022 | $244.6B net to Ottawa | Net $71.1B received from Washington in 2022 alone |
Sources: Rockefeller Institute 2022; Statistics Canada; Fraser Institute; Fairness Alberta.
The Texas model does not produce a wealthier energy state that keeps more of its own money. It produces an energy state that, because it has large populations of lower-income residents and pays lower taxes per capita than California or New York, ends up receiving net federal redistribution.
2.2 The Pipeline Problem: Federal Control Doesn’t Disappear
The most persistent political grievance in Alberta is federal obstruction of pipeline construction. The implicit assumption in the Texas comparison is that in an American-style federal system, Alberta would control its own pipelines.
It would not. Interstate pipelines in the U.S. are regulated by the Federal Energy Regulatory Commission (FERC), an independent federal agency. No state has the authority to approve, reject, or set rates for a pipeline that crosses a state line.5
Institutional fact: Texas has the largest pipeline infrastructure in the United States — roughly one-sixth of all U.S. pipeline mileage. It has no control over the pipelines that cross into other states. That authority rests entirely with Washington. The federal pipeline problem does not disappear under American federalism; it has a different acronym.
The 2021 Texas winter storm — in which the state’s electricity grid collapsed, killing over 200 people — illustrated another dimension. Texas runs its own grid (ERCOT) specifically to avoid federal regulation. When it failed catastrophically, the state had no federal backstop. Independence from federal regulation produced fragility, not strength.
2.3 The Tax Calculation
| Tax Comparison | Alberta Resident (C$150,000) | Texas Resident (US$110,000 equiv.) |
|---|---|---|
| Federal income tax | Paid to CRA at federal rates | Paid to IRS at federal rates (similar brackets) |
| Provincial/state income tax | ~10–14% provincial rate | Zero — no state income tax |
| Sales tax | 5% GST only (no PST) | 6.25% state + up to 2% local = 8.25% |
| Property taxes | Lower — provincial education levy | Among highest in U.S. — fund schools locally |
| Healthcare | Included in public system | Employer/private — median cost $7,500+/year |
| Net effective burden | Moderate — healthcare included | Often higher when healthcare costs included |
The no-state-income-tax status that makes Texas popular among high earners looks different when adding healthcare costs, higher property taxes, and the realization that public services in Texas are noticeably below Canadian standards in a number of categories.
2.4 The Bust Lesson
Texas’s energy economy has been through multiple catastrophic price collapses.6
Between 1982 and 1987, Houston lost 211,000 jobs as oil prices collapsed. Texas saw more bank failures between 1980 and 1990 than any other state. Real estate prices fell 25–30%. The Savings and Loan crisis required a massive federal bailout.7
Alberta went through its own version in 2014–2017, losing roughly 100,000 high-wage jobs. The difference is that during Alberta’s bust, federal unemployment insurance, stabilization mechanisms, and interprovincial labour mobility cushioned the blow in ways that the Texas state government — with its limited revenue base — cannot replicate.
Part C: Two Very Different Products
3.1 What Each Deposit Actually Is
| Feature | Permian Basin (Texas/New Mexico) | Athabasca Oil Sands (Alberta) |
|---|---|---|
| Deposit type | Light tight oil (shale) | Bitumen — ultra-heavy oil in sand |
| Estimated reserves | ~46 billion barrels proved | ~163 billion barrels proved (Canada) |
| Production method | Hydraulic fracturing of horizontal wells | Open-pit mining or SAGD |
| Output quality | Light, sweet — 38–45 API gravity | Heavy, sour — 8–12 API gravity (bitumen) |
| Refinery compatibility | Compatible with most refineries as-is | Requires dilution (dilbit) or upgrading |
| Capital intensity | Well drilled in days; production starts immediately | Facilities require billions and years |
| Decline rate | 60–80% year 1; requires constant redrilling | Stable for 30–50 years once built |
| 2024 production | ~6.3 million bbl/day | ~3.7 million bbl/day |
Sources: U.S. EIA, Enverus Intelligence Research, CAPP, Library of Parliament.89
3.2 The Cost Structure
| Cost Metric | Permian Basin | Oil Sands (existing SAGD/mining) |
|---|---|---|
| New well breakeven (WTI) | $62–64/bbl (2024) | $74/bbl avg; top-tier SAGD needs $80+ greenfield |
| Operating cost (existing) | $8–10/bbl LOE | $23–30/bbl USD operating cost |
| Breakeven for existing production | ~$30–40/bbl (sunk capital) | ~$30–50/bbl (once facility built) |
| Production decline rate | 60–80% in year 1 | Essentially flat for 30–50 years |
| Capital reinvestment required | Continuous treadmill | Minimal once sunk |
| Price differential to WTI | Minimal | WCS typically C$10–20 below WTI |
| Long-run supply cost (full cycle) | Rising — core acreage depleting | Stable to declining with efficiency gains |
Sources: Dallas Federal Reserve Energy Survey 2024; EIA; Enverus 2025; ATB Financial.10
Different business models: The Permian’s advantage is speed and flexibility — drill in days, produce immediately, stop when prices fall. The oil sands’ advantage is durability — once the billions are spent, production is stable for decades at declining operating cost. These are genuinely different business models, not just versions of the same thing.
U.S. shale breakeven costs are forecast to rise from ~$70/bbl today to $95/bbl by 2035 as core Permian acreage is exhausted. Oil sands operating costs have been declining — Suncor reduced its breakeven by US$7/barrel in 2024 alone. The long-run economics may be converging, but not in the direction most critics of the oil sands assume.
3.3 Geopolitical Positioning
| Vulnerability Factor | Permian | Oil Sands |
|---|---|---|
| OPEC+ price war exposure | High — new drilling pauses rapidly | Moderate — existing production continues |
| Energy transition risk | Moderate — can run down inventory faster | Higher — long-cycle assets at risk if demand peaks |
| Market access | Domestic pipeline + Gulf Coast export | Requires pipeline to U.S. or Pacific coast |
| Price discount | Minimal | Persistent WCS-WTI spread of C$10–20/bbl |
| Inventory longevity | Core acreage depleting | ~163B barrels; essentially unlimited at current rates |
3.4 The Refinery Mismatch
Bitumen is not interchangeable with Permian crude. Midwestern U.S. refineries (the PADD 2 complex) were specifically retooled to process heavy Canadian crude — these are Alberta’s natural customers. The WCS discount reflects this constraint: because Alberta crude can only go to certain refineries via certain pipelines, buyers have pricing power.
Permian crude is light, sweet, and trades near WTI because it can go to almost any refinery in the world. A barrel of WTI-quality crude can be sold to a Korean, Spanish, or Louisiana refinery with equal ease. A barrel of dilbit needs to go somewhere specifically equipped for it. This constrains Alberta’s negotiating position in ways that have nothing to do with federal politics and everything to do with chemistry.
Part D: Six Conclusions
Conclusion 1: The fiscal comparison runs opposite to what most Albertans assume. Alberta contributes $17 billion+ per year above what it receives. Texas receives $71 billion net. Moving to an American-style federal system would not obviously change this dynamic.
Conclusion 2: Federal pipeline control does not disappear under American federalism. Texas cannot approve a pipeline crossing state lines. Keystone XL was regulated federally from the start. An Alberta in the U.S. would trade the NEB for FERC.
Conclusion 3: The boom-bust cycle is not mitigated by American federalism. Houston’s 1980s collapse destroyed a quarter of a million jobs and required a federal bailout. Canada’s social safety net has cushioned Alberta’s downturns in ways American state government cannot replicate.
Conclusion 4: Alberta’s oil is technically different from Permian oil. Bitumen is heavier, more expensive to process, requires specific infrastructure, and sells at a persistent discount. These are geological facts, not political choices.
Conclusion 5: Oklahoma is a useful additional benchmark. Its median household income is 21% below the national average. Its poverty rate is among the highest in the nation. The Texas comparison is aspirational; the Oklahoma comparison is cautionary — both are informative.
Conclusion 6: The comparison is politically useful and economically imprecise. The important details — fiscal flows, pipeline jurisdiction, healthcare costs, product type, refinery configurations, boom-bust cushioning — all complicate the simple narrative.
The more instructive exercise is to ask not “why can’t Alberta be Texas?” but “what has actually happened to energy-dependent American states over the last fifty years?” The answer, in Texas and Oklahoma alike, is: spectacular booms, brutal busts, persistent inequality, and a federal government that was ultimately called upon when things went wrong — just as Ottawa has been called upon by Alberta.
Sources and Data Notes
All U.S. dollar figures in USD; Canadian figures in CAD unless noted. Exchange rate: 1 CAD ≈ 0.73 USD throughout 2024.
| Source | Data Used |
|---|---|
| U.S. Bureau of Economic Analysis (BEA) | Texas and Oklahoma GDP, per capita income, growth rates |
| Dallas Federal Reserve | Texas snapshot; Permian breakeven survey 2024; energy employment |
| Rockefeller Institute of Government | Texas-U.S. federal balance of payments 2022 |
| U.S. Energy Information Administration (EIA) | Permian production volumes, U.S. oil production |
| Oklahoma Energy Resources Board (OERB) | Oklahoma oil & gas GDP contribution FY2024 |
| Kansas City Federal Reserve | Oklahoma GDP growth volatility, boom-bust analysis |
| Federal Energy Regulatory Commission (FERC) | Interstate pipeline jurisdiction |
| Statistics Canada / Fraser Institute / Fairness Alberta | Alberta fiscal contribution data |
| Enverus Intelligence Research, April 2025 | Oil sands cost structure, SAGD economics |
| Texas Tribune / Texas Monthly | 1980s oil bust history |
| U.S. Census Bureau | Oklahoma poverty rate, household income comparisons |
| FDIC Historical Records | Texas/Oklahoma bank failure data 1980–1990 |
References
Bureau of Economic Analysis (BEA). 2024. Gross Domestic Product by State, 2023. Washington, DC: U.S. Department of Commerce. https://www.bea.gov/data/gdp/gdp-state
Canada Energy Regulator (CER). 2025. “Market Snapshot: Canada Sets New Record in Crude Oil Production in 2024 and First Half of 2025.” Calgary: CER. https://www.cer-rec.gc.ca/en/data-analysis/energy-markets/market-snapshots/2025/market-snapshot-canada-sets-new-record-in-crude-oil-production-in-2024-and-first-half-of-2025.html
Canadian Association of Petroleum Producers (CAPP). 2024. Crude Oil Forecast, Markets and Transportation. Calgary: CAPP. https://www.capp.ca/resources/crude-oil-forecast/
Canadian Energy Centre. 2024. “97% of Canada’s 163 Billion Barrels of Proven Oil Reserves Are in Alberta’s Oil Sands.” Calgary: CEC. https://www.canadianenergycentre.ca/graphic-97-of-canadas-163-billion-barrels-of-proven-oil-reserves-are-in-albertas-oil-sands/
Enverus Intelligence Research. 2025. Oil Sands Cost Structure and SAGD Economics. April 2025. Austin: Enverus. (subscription research service; no public URL available)
Fairness Alberta. 2024. Alberta’s Fiscal Contributions to Canada. Edmonton: Fairness Alberta. https://fairnessalberta.ca/fiscal-fairness/
Federal Deposit Insurance Corporation (FDIC). 1997. History of the Eighties — Lessons for the Future, Volume I: An Examination of the Banking Crises of the 1980s and Early 1990s. Washington, DC: FDIC. https://www.fdic.gov/bank/historical/history/
Federal Energy Regulatory Commission (FERC). 2024. What FERC Does. Washington, DC: FERC. https://www.ferc.gov/what-ferc-does
Fraser Institute. 2025. “Understanding Alberta’s Role in National Programs, Including the Canada Pension Plan.” Vancouver: Fraser Institute. https://www.fraserinstitute.org/studies/understanding-albertas-role-national-programs-including-canada-pension-plan
Kansas City Federal Reserve. 2020. The Oklahoma Economist: Energy Boom and Bust Impacts. Kansas City: Federal Reserve Bank of Kansas City. https://www.kansascityfed.org/oklahomacity/oklahoma-economist/
Library of Parliament. 2024. Alberta’s Merchandise Trade with the World. Publication No. 2024-501-E. Ottawa: Library of Parliament. https://lop.parl.ca/sites/PublicWebsite/default/en_CA/ResearchPublications/TradeAndInvestment/2024501E
Oklahoma Energy Resources Board (OERB). 2024. Oil and Natural Gas’s Economic Contribution to Oklahoma, FY 2024. Oklahoma City: OERB. https://www.oerb.com/what-we-do/research
Rockefeller Institute of Government. 2023. New York’s Balance of Payments with the Federal Government, 2022 Edition. Albany: Rockefeller Institute. https://rockinst.org/issue-area/balance-of-payments-2022/
Statistics Canada. 2025. Provincial and Territorial Economic Accounts, 2024. Ottawa: Statistics Canada. https://www150.statcan.gc.ca/n1/daily-quotidien/251106/dq251106a-eng.htm
U.S. Census Bureau. 2024. American Community Survey: Income and Poverty in the United States, 2023. Washington, DC: U.S. Census Bureau. https://www.census.gov/topics/income-poverty/poverty.html
U.S. Energy Information Administration (EIA). 2024. Permian Basin Drilling Productivity Report. Washington, DC: EIA. https://www.eia.gov/petroleum/drilling/#tabs-summary-2
U.S. Energy Information Administration (EIA). 2024. Texas State Energy Profile. Washington, DC: EIA. https://www.eia.gov/state/analysis.php?sid=TX
World’s Top Exports. 2024. “Top Exports from Texas 2024.” https://www.worldstopexports.com/top-10-exports-from-texas/
Previous: A Trade Reality Check · Next: Contested Ground
-
Rockefeller Institute of Government, federal balance of payments data, 2022. ↩
-
Kansas City Federal Reserve, Oklahoma Economist series. ↩
-
Rockefeller Institute of Government, Annual Fiscal Flows report, 2022. ↩
-
Fairness Alberta fiscal contribution data; Statistics Canada Fiscal Reference Tables. ↩
-
Federal Energy Regulatory Commission, regulatory authority and jurisdiction summary. ↩
-
FDIC Historical Records, “Banking Problems in the Southwest,” Texas/Oklahoma bank failure data 1980–1990. ↩
-
Texas Tribune; Texas Monthly; Houstonia Magazine — Houston oil bust retrospectives. ↩
-
U.S. Energy Information Administration, Permian Basin production data, 2024. ↩
-
Enverus Intelligence Research, oil sands cost structure, April 2025. ↩
-
Dallas Federal Reserve, Quarterly Energy Survey, 2024. ↩